Economically disadvantaged students in Arkansas graduated at 86.9 percent in 2024. The state average was 89.0 percent. The gap between them was 2.1 percentage points.
In most states, the graduation gap between students from low-income families and the overall average runs 10 to 15 points. In some, it exceeds 20. Arkansas's gap of 2.1 points is not just small. It is difficult to find a comparable number anywhere in the country.
The Gap Has Been Shrinking
The gap by income started at 3.2 points in 2016 and has narrowed over the years since, though not in a straight line.
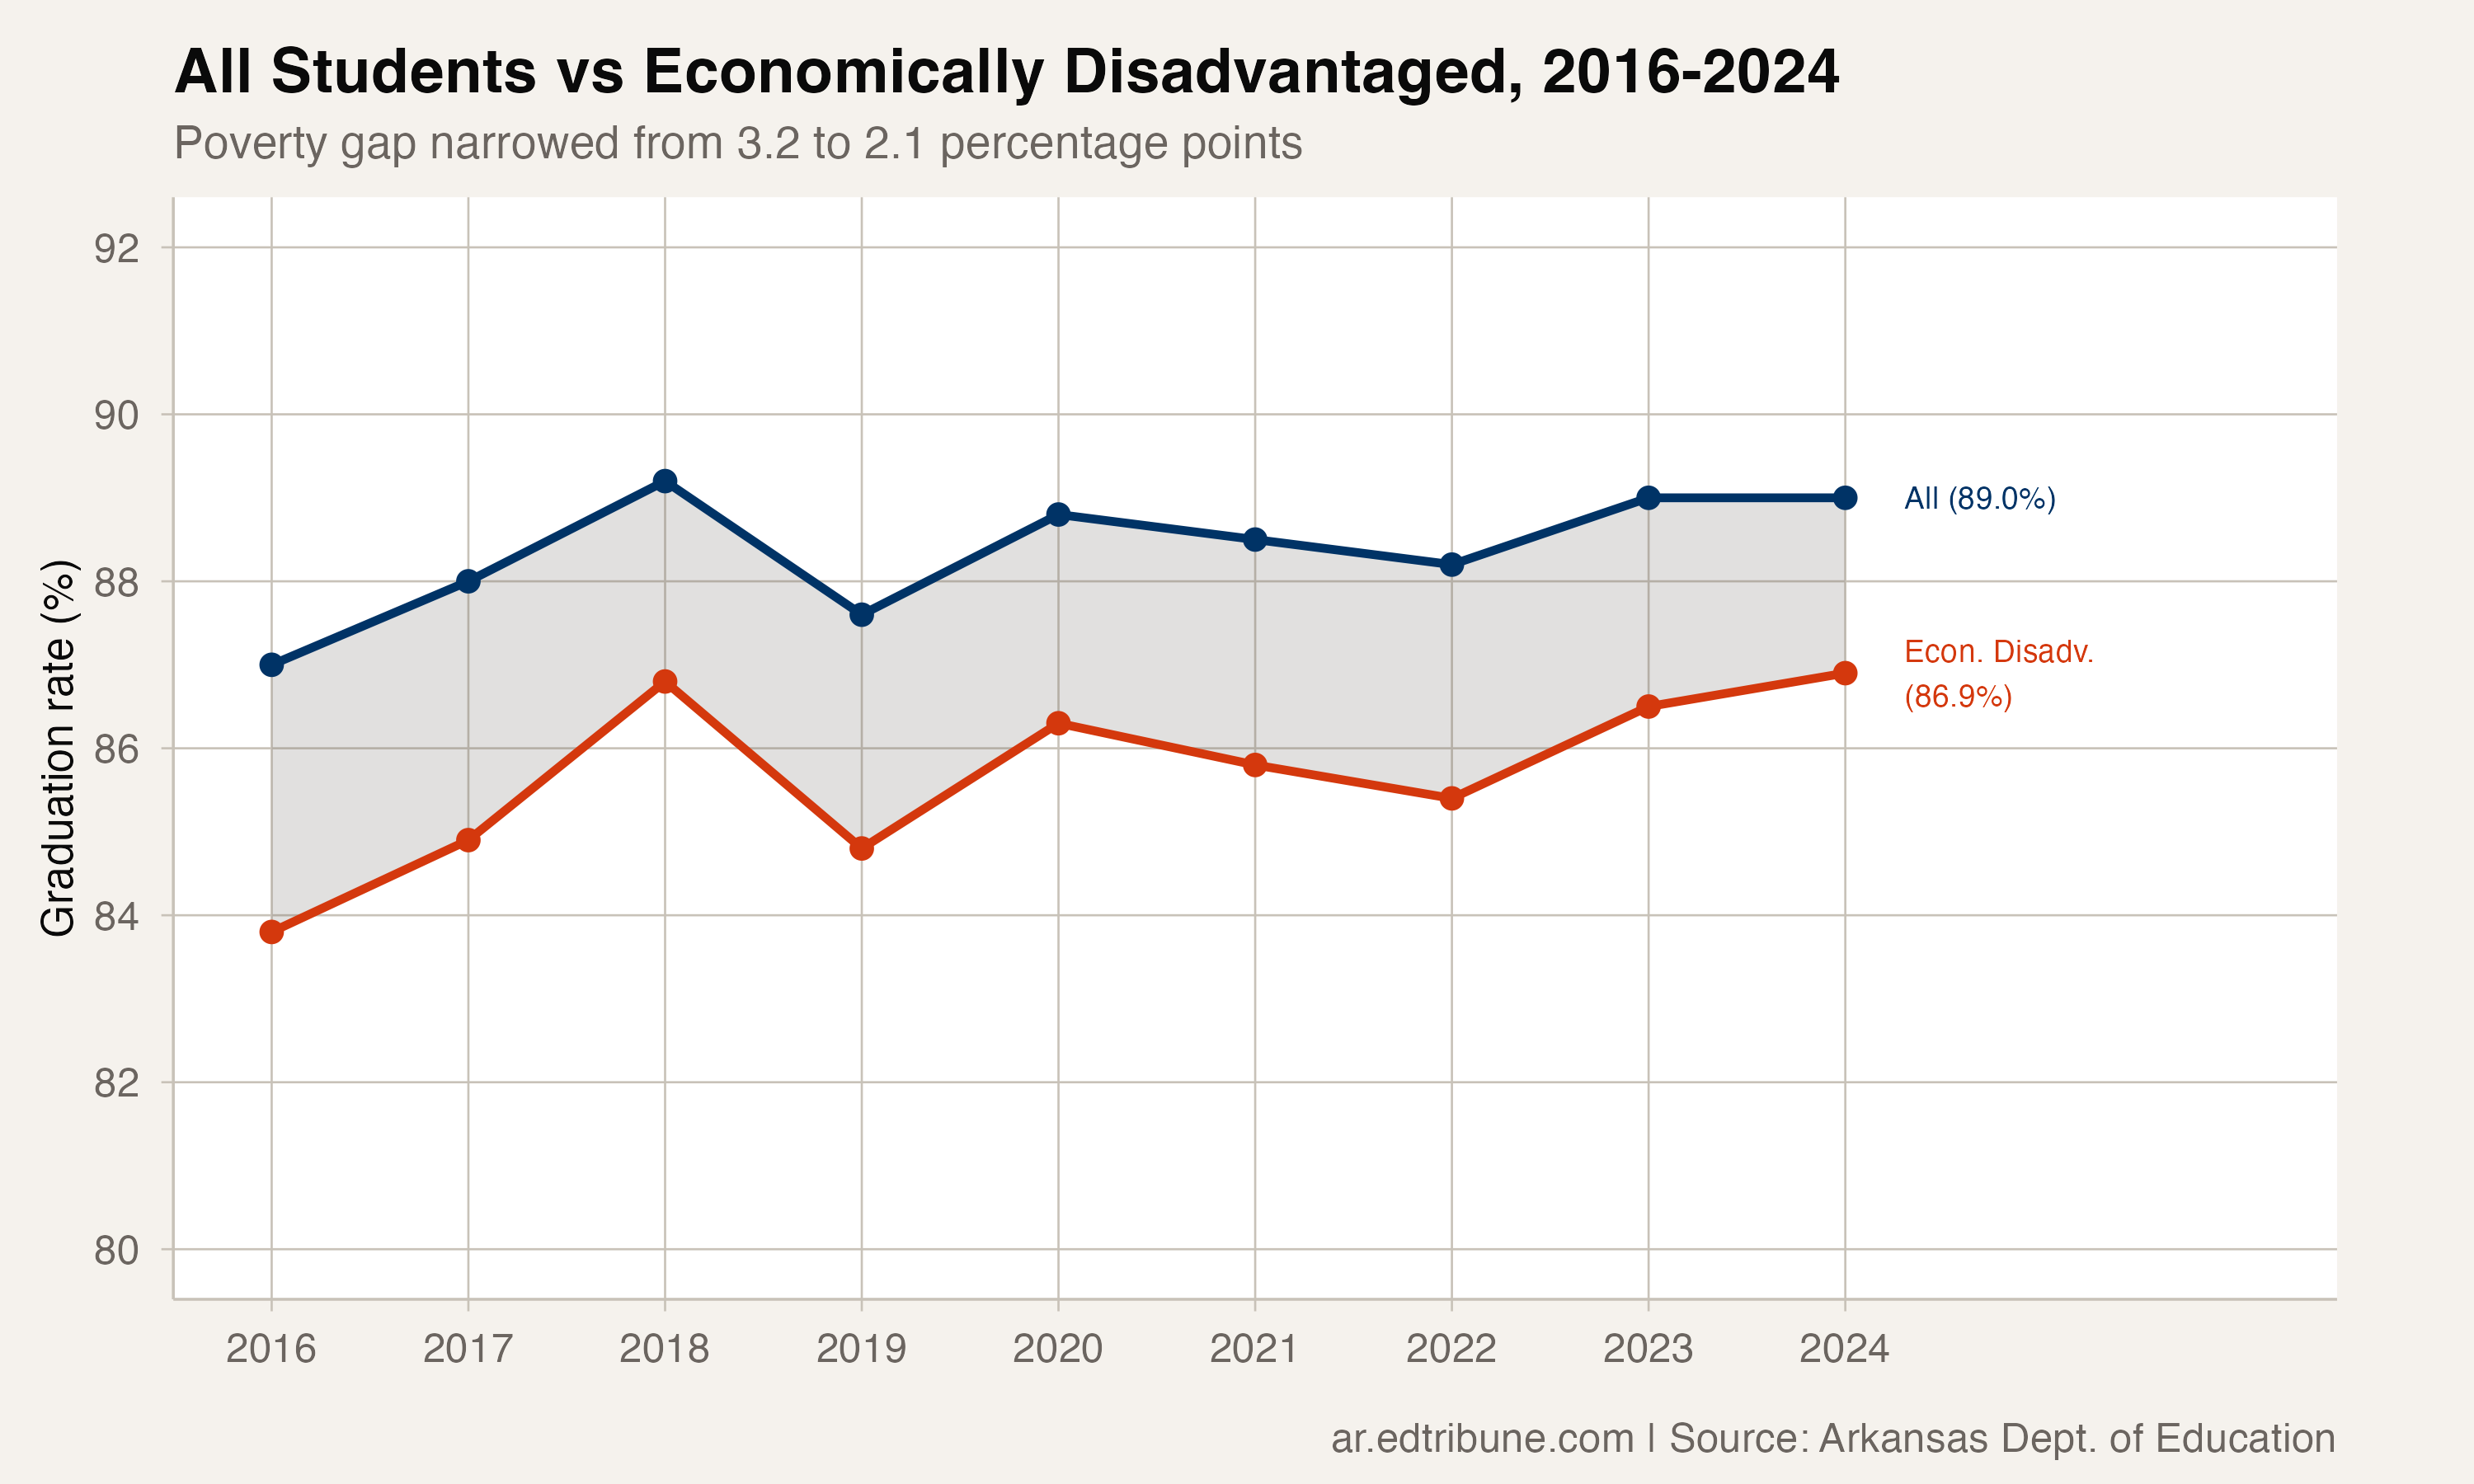
Economically disadvantaged students gained 3.1 points over the period, from 83.8 to 86.9 percent. The overall rate gained 2 points. The faster improvement at the bottom pulled the gap from 3.2 points to 2.1, a reduction of more than a third.
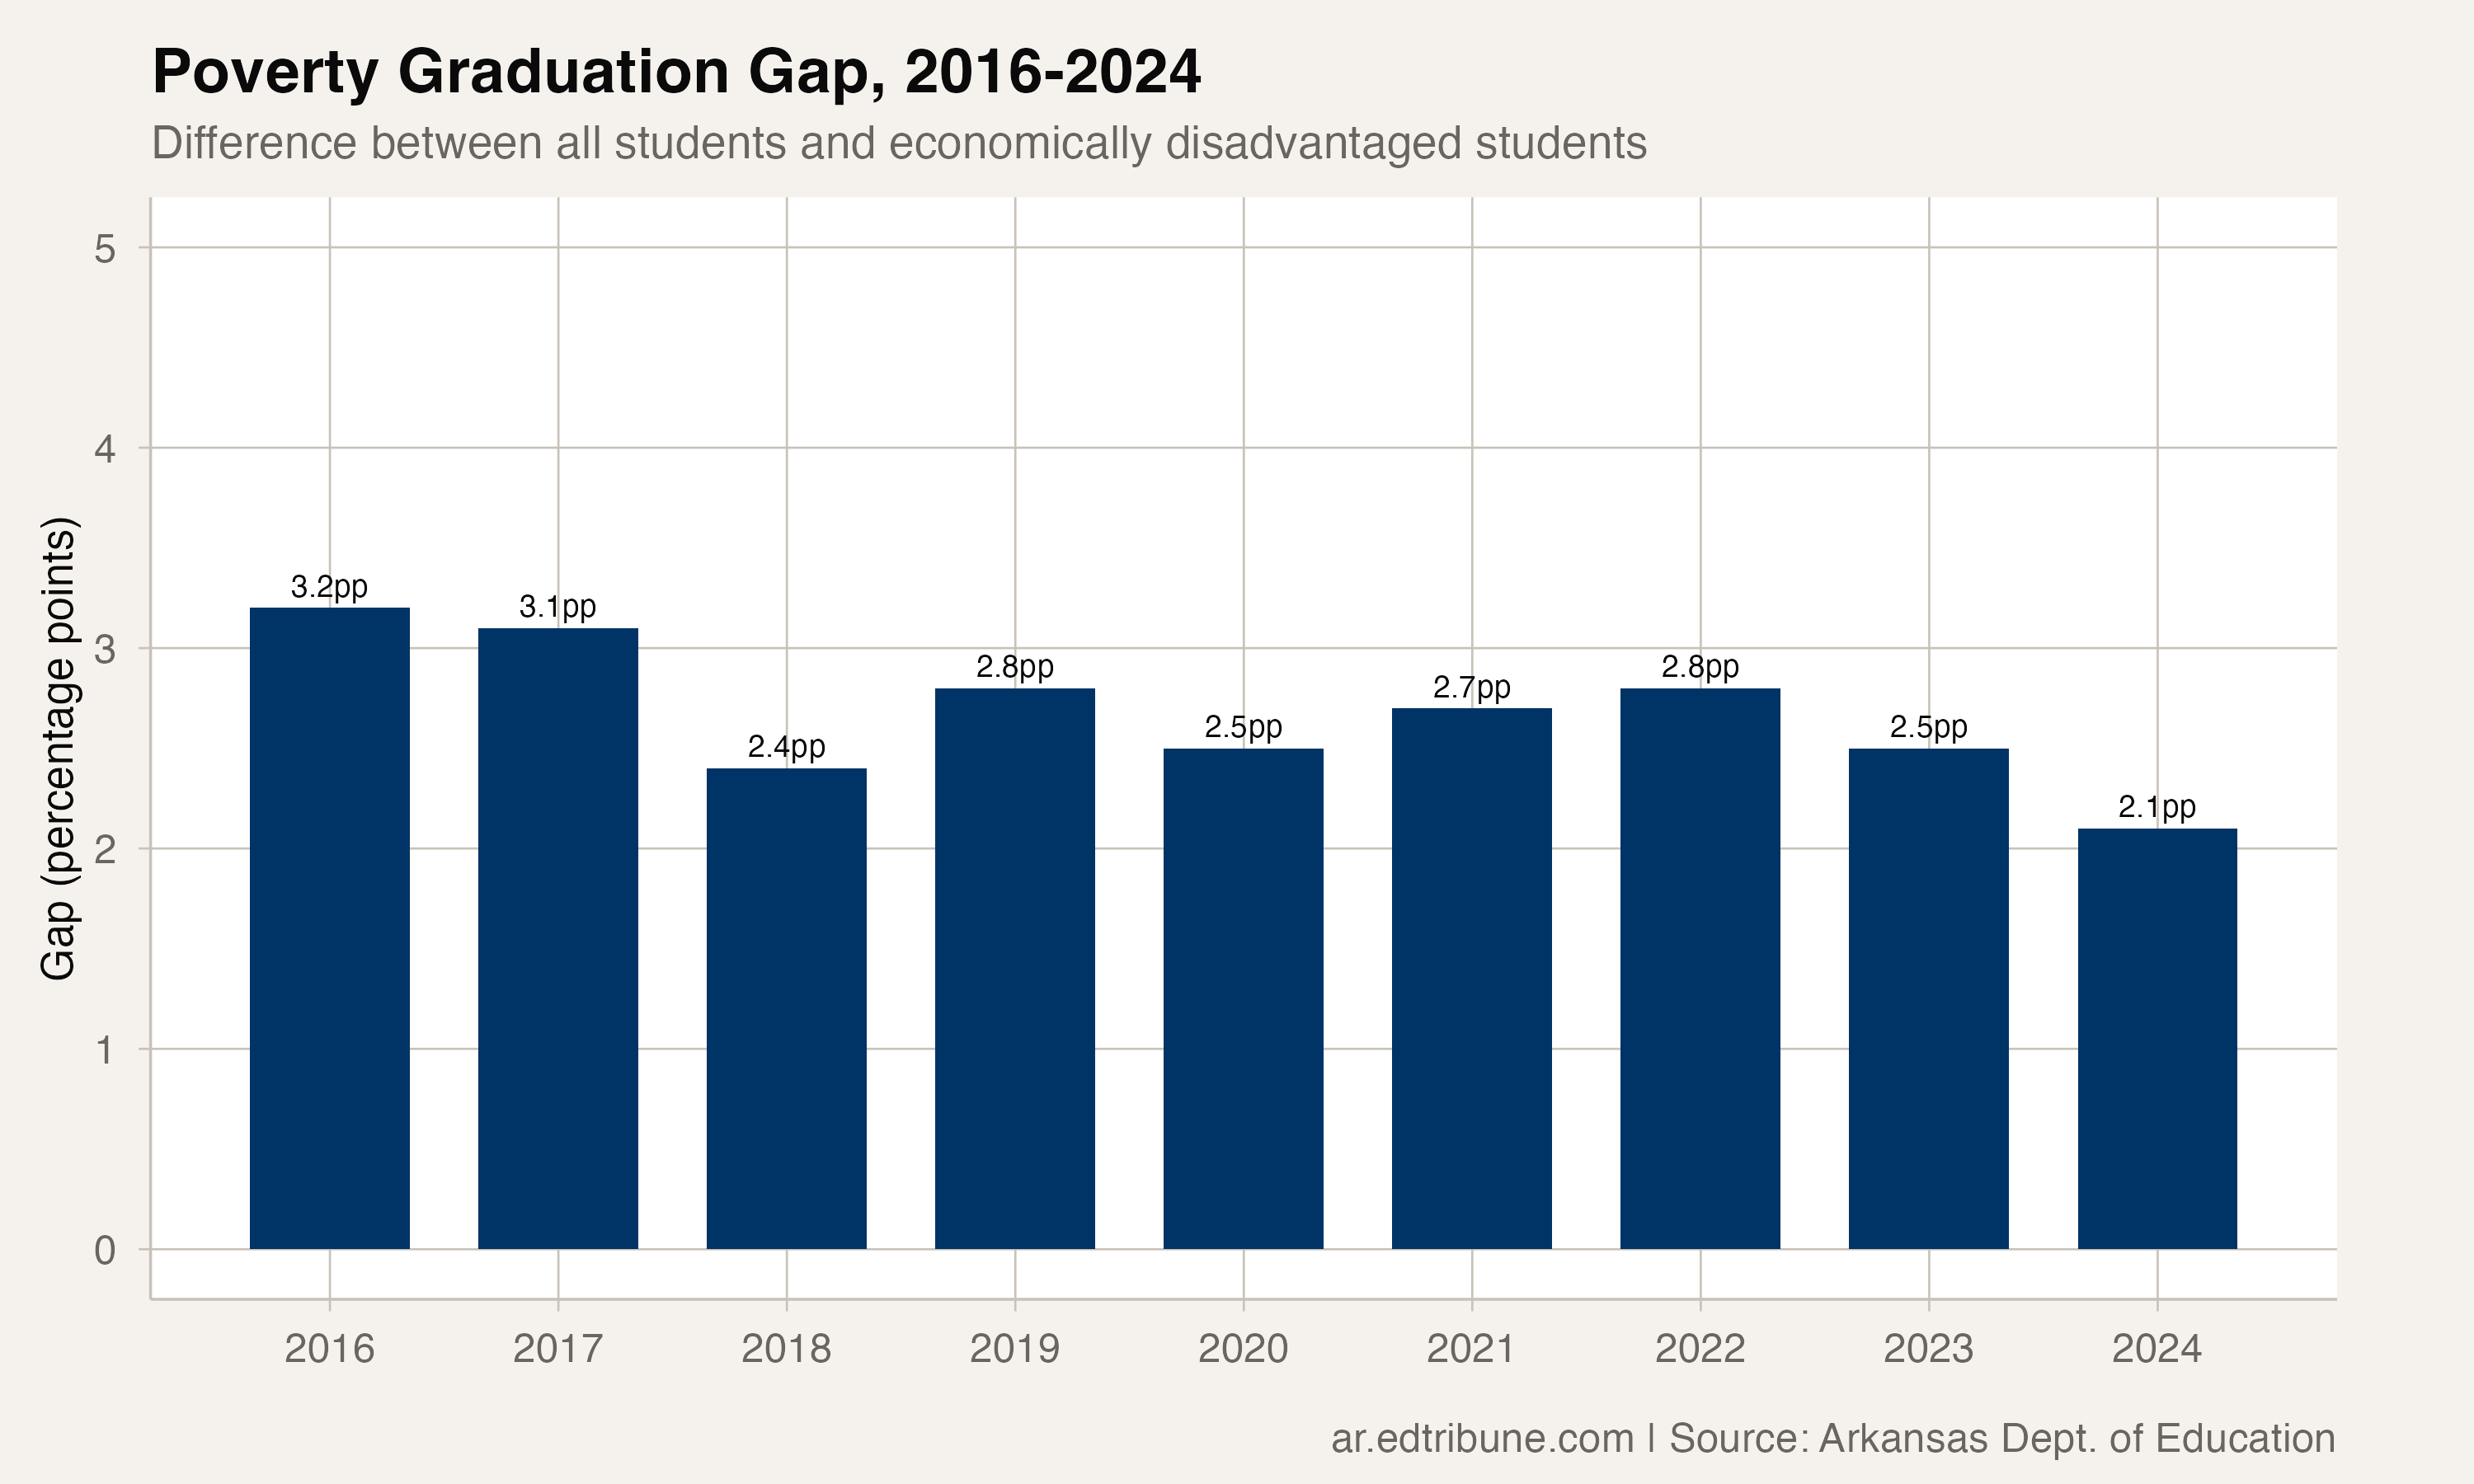
The gap did not shrink every year. It tightened to 2.4 points in 2018, drifted back up into the high 2s through 2022, then closed again to 2.5 in 2023 and 2.1 in 2024. The 2.1-point gap in 2024 is the narrowest in the series. The widest, 3.2 points in 2016, would still be narrow by national standards.
Why the Gap Is So Small
Part of the explanation is structural. Arkansas has one of the highest poverty rates in the country, which means the economically disadvantaged subgroup includes a very large share of the student population. When the subgroup is large, its graduation rate tends to converge toward the overall average simply because it constitutes so much of the denominator.
But that is not the whole story. The gap has narrowed even as the subgroup's composition has remained relatively stable. Students who are economically disadvantaged in Arkansas are genuinely graduating at higher rates than they did nine years ago — and faster than the overall population.
How the Income Gap Compares to Other Gaps
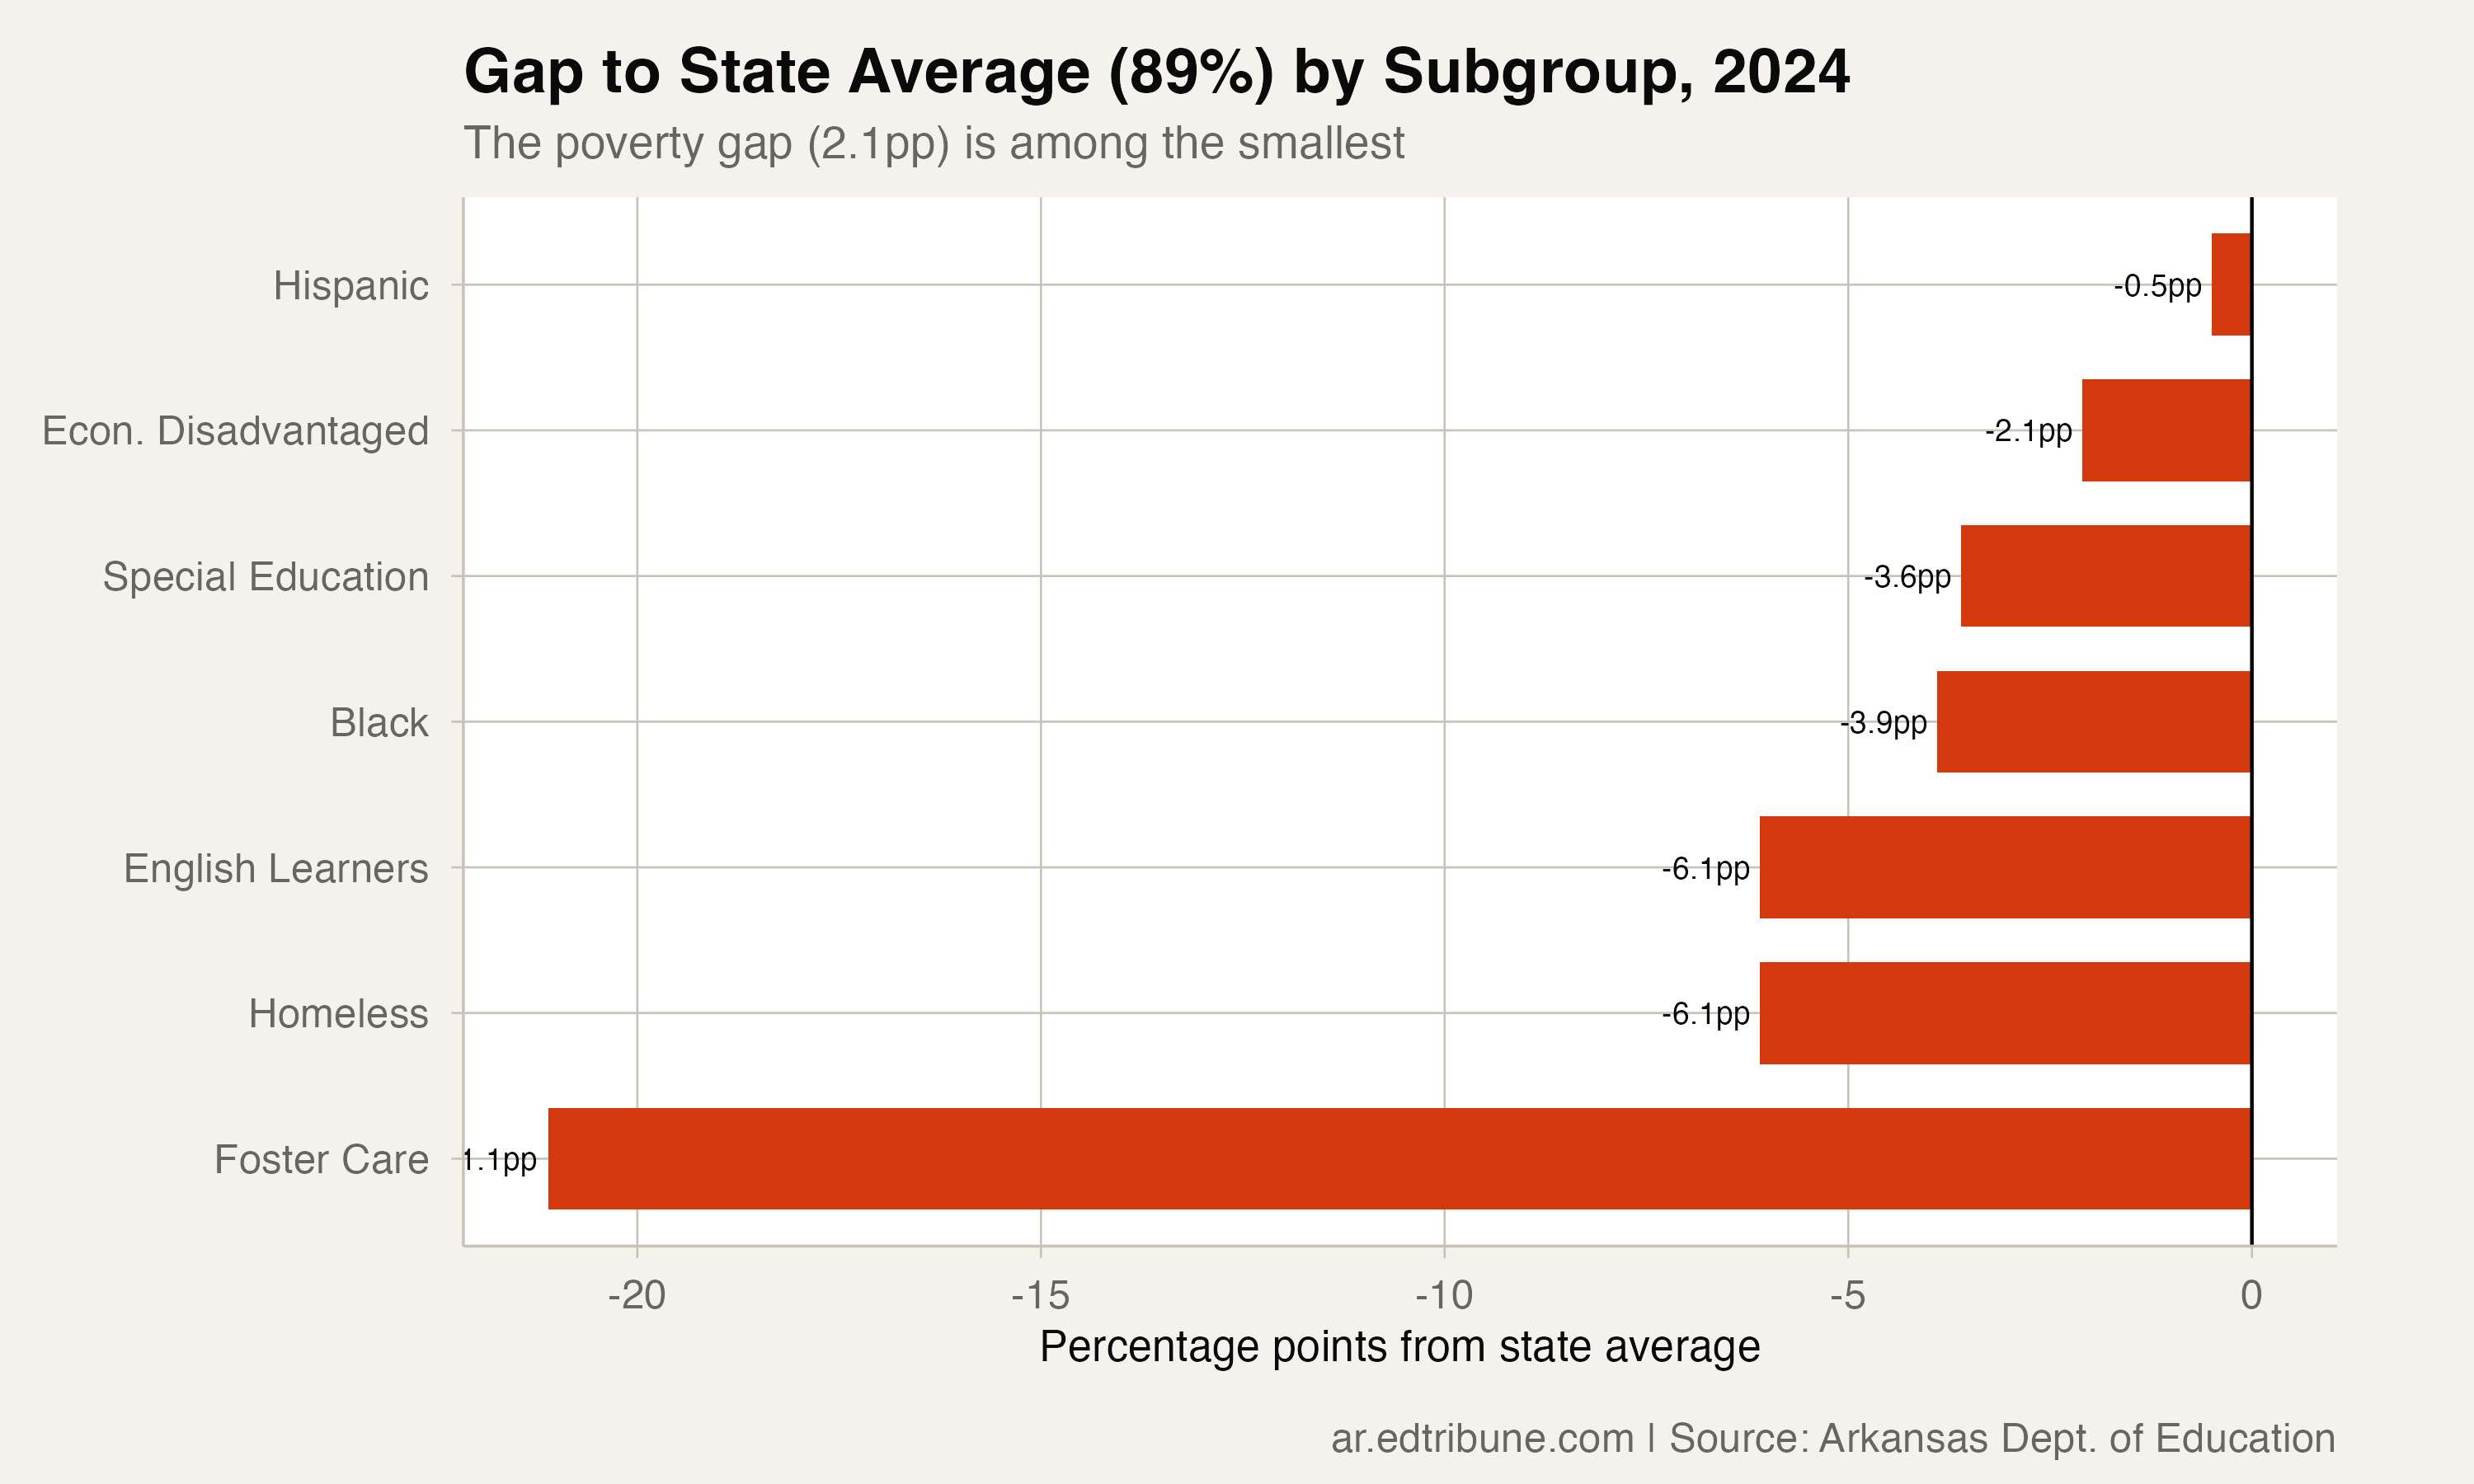
The income gap of 2.1 points is smaller than almost every other subgroup gap in Arkansas. The white-Black gap is 5.5 points. The gender gap (female minus male) is 4 points. English learners are 6.1 points below average. Students experiencing homelessness are 6.1 points below.
Among racial and ethnic groups that graduate below the state average, only Hispanic students, at 88.5 percent (0.5 points below average), have a narrower gap than economically disadvantaged students do.
The outlier remains foster care. Students in the foster care system graduate at 67.9 percent, 21.1 points below the state average. The income gap is closing; the foster care gap is not.
By the numbers: Economically disadvantaged students graduate at 86.9%, up from 83.8% in 2016. The income gap narrowed from 3.2 to 2.1 points, one of the smallest in the nation.
What 2.1 Points Does and Does Not Mean
A 2.1-point gap means that for practical purposes, knowing whether a student in Arkansas is economically disadvantaged tells you almost nothing about whether they will graduate. The subgroup's rate (86.9 percent) is higher than the overall graduation rate in more than a dozen states.
What the number does not tell you is whether these graduates are equally prepared. Graduation rates measure completion, not proficiency. A student who earns a diploma with minimal academic skills counts the same as one who excels. Arkansas's ACT scores and college readiness metrics show much larger gaps between income groups, gaps that the graduation rate does not capture.
The number also does not capture the districts where economic hardship is most concentrated. In the Delta, where poverty is deepest, district-level graduation rates for economically disadvantaged students drop well below 80 percent. The statewide gap is narrow, but the strain is not evenly distributed.
Detailed code that reproduces the analysis and figures in this article is available exclusively to EdTribune subscribers.
Discussion
Sign in to join the discussion.
Loading comments...