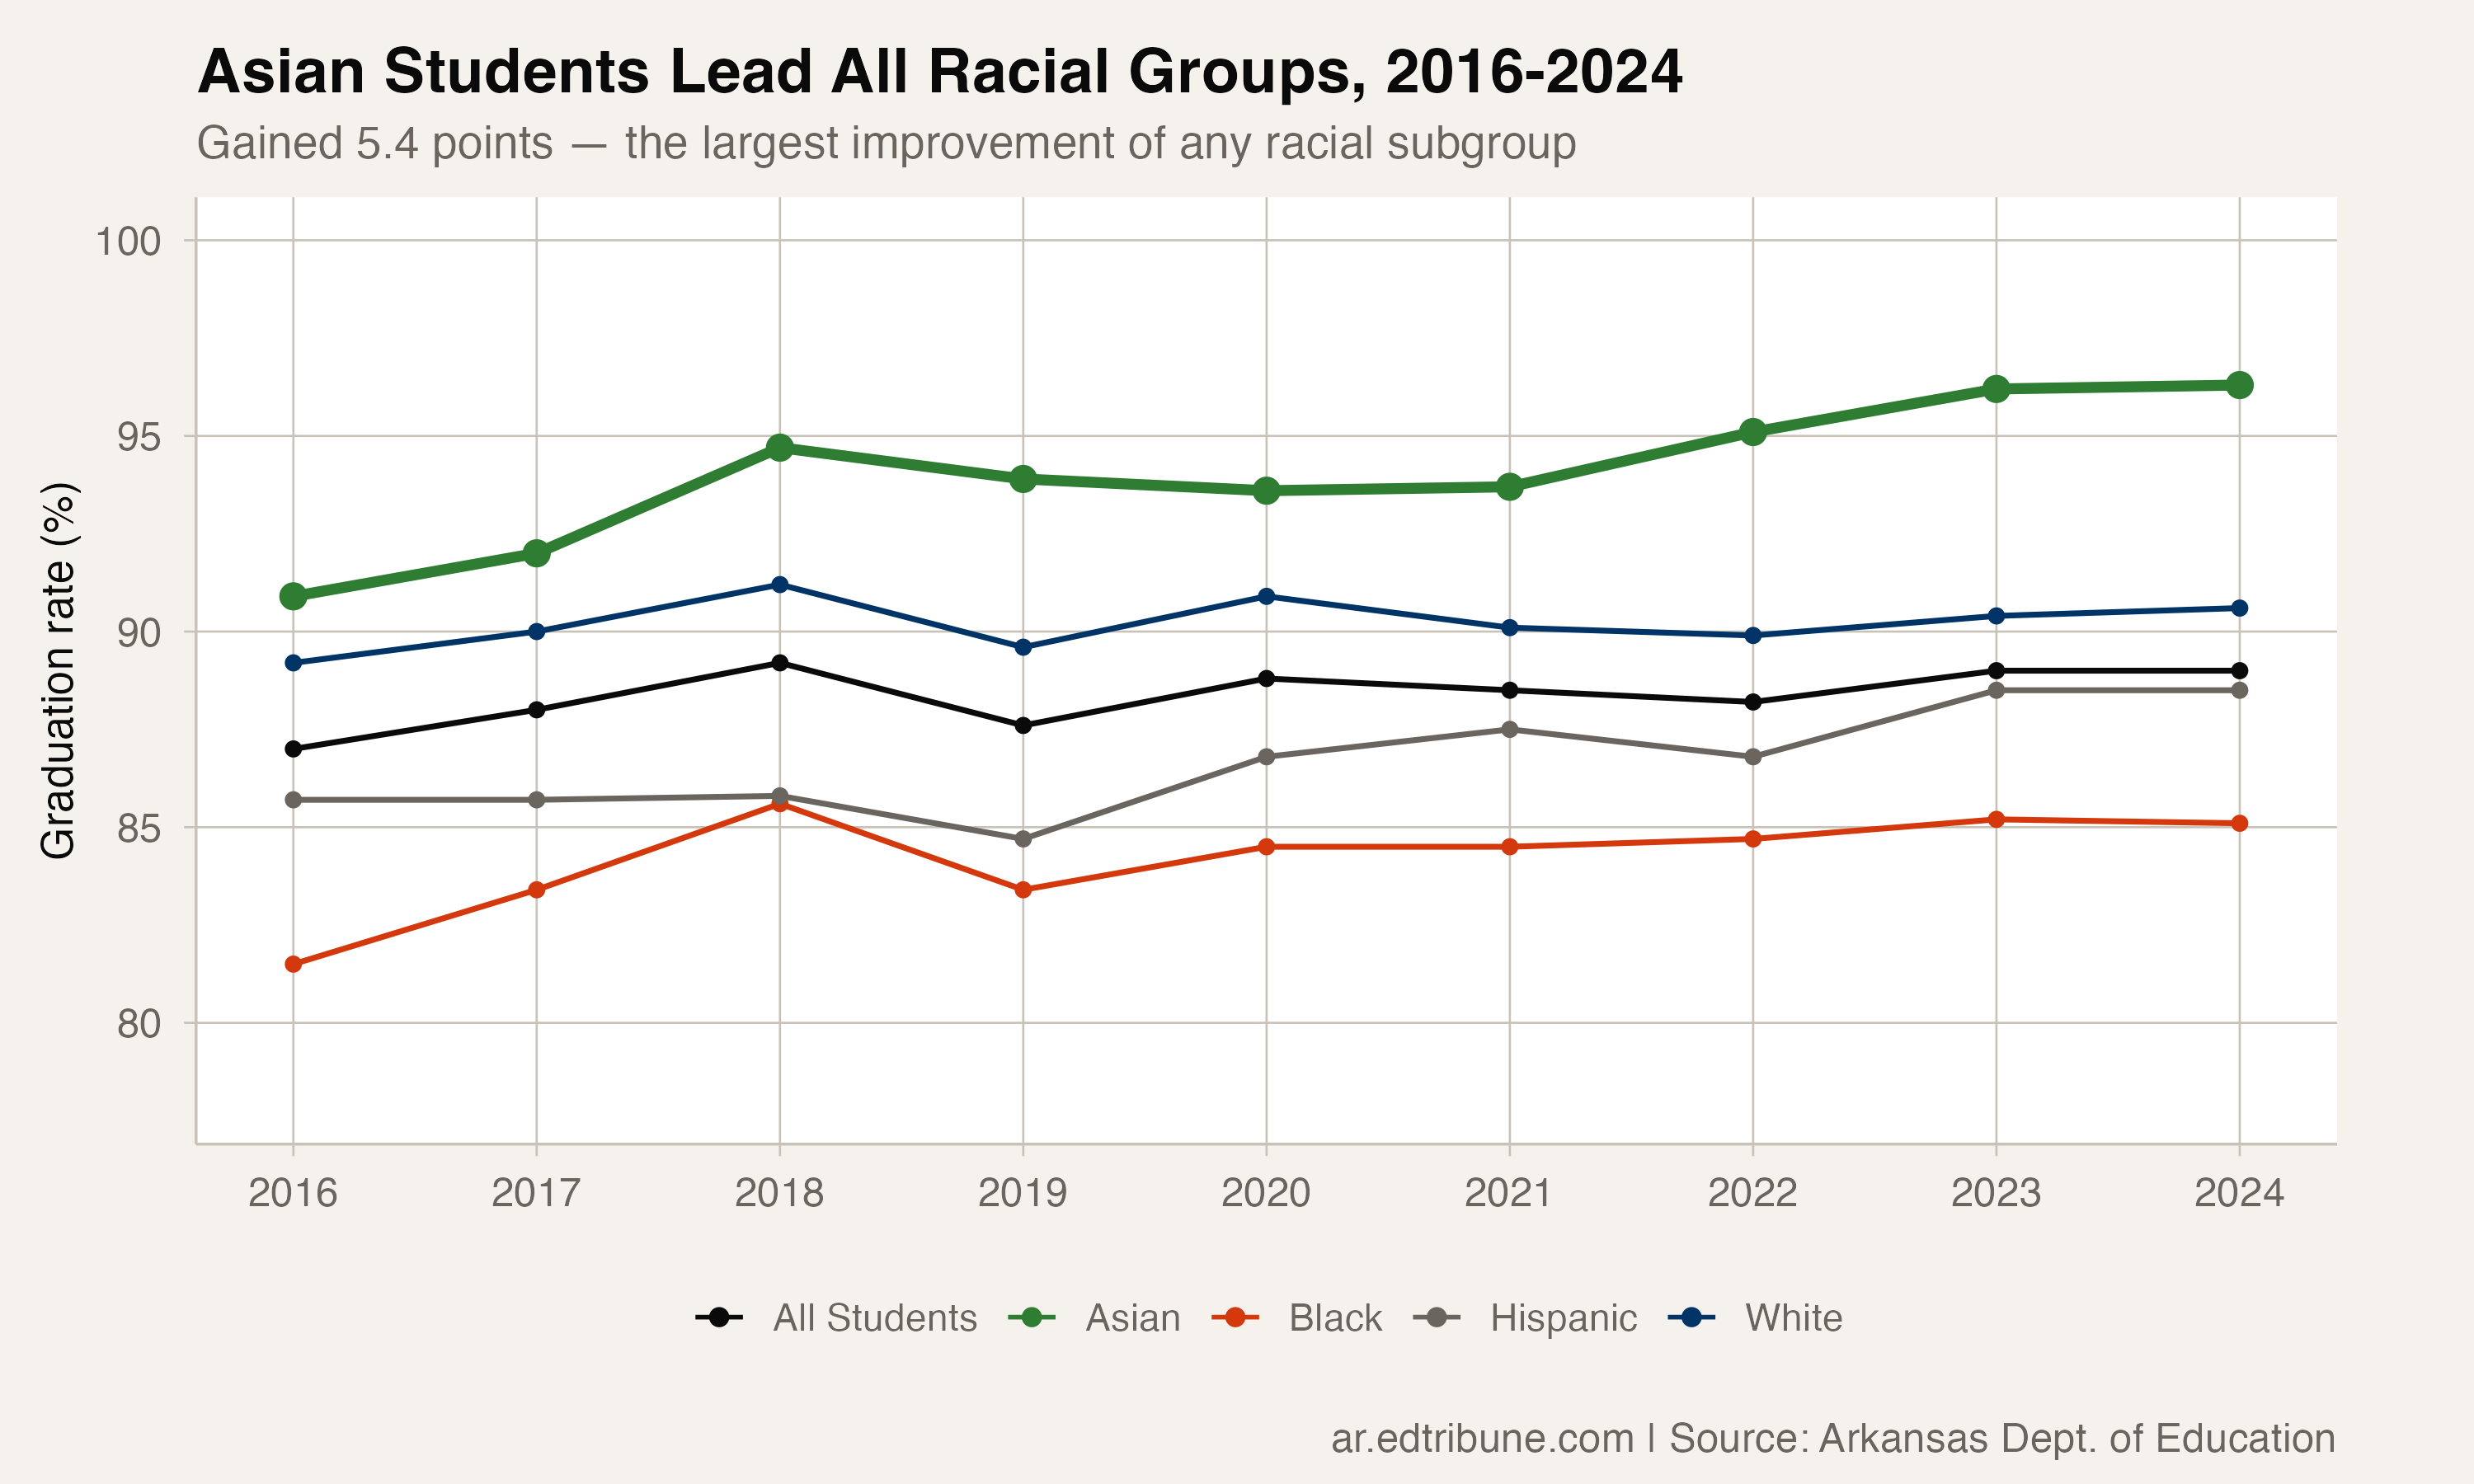
Asian students in Arkansas graduated at 96.3 percent in 2024. That is the highest rate of any racial subgroup in the state, higher than white students (90.6 percent) and higher than the state average (89 percent), and it is not particularly close.
The number is also the endpoint of the largest improvement arc of any racial group. In 2016, Asian students graduated at 90.9 percent. Over nine years, they gained 5.4 points, while white students gained 1.4 and the overall average gained 2.
The Marshallese Factor
The improvement is all the more striking because of who makes up Arkansas's Asian student population. This is not a story about affluent East Asian suburbs, the kind that drives Asian achievement statistics in states like California and New Jersey.
Arkansas is home to the largest Marshallese community in the continental United States, concentrated in Northwest Arkansas around Springdale↗ET and Rogers↗ET. Marshallese families began migrating to the region in the 1980s, drawn by poultry industry jobs. The community now numbers in the tens of thousands.
Marshallese students come from a Pacific Island nation where English is a second language, where the K-12 system looks nothing like what they encounter in Arkansas, and where family poverty rates are high. Their inclusion in the Asian subgroup, alongside students from Vietnamese, Indian, Chinese, and other backgrounds, makes Arkansas's Asian graduation trend meaningfully different from the national pattern.
The fact that the rate improved by 5.4 points despite the growing share of Marshallese students in the denominator suggests that school systems in Northwest Arkansas have built effective support structures for this community.
Northwest Arkansas Graduation Landscape
The districts where Asian students are most concentrated are all in the NWA corridor:
- Bentonville↗ET: 94.9 percent overall graduation rate
- Rogers↗ET: 94.4 percent
- Fayetteville↗ET: 93.1 percent
- Springdale↗ET: 88.1 percent
Springdale, which has the largest Marshallese population, has the lowest graduation rate of the four. But at 88.1 percent, it is within a point of the state average, a strong showing for a district where a significant share of students are navigating language and cultural barriers.
The Improvement Leaders
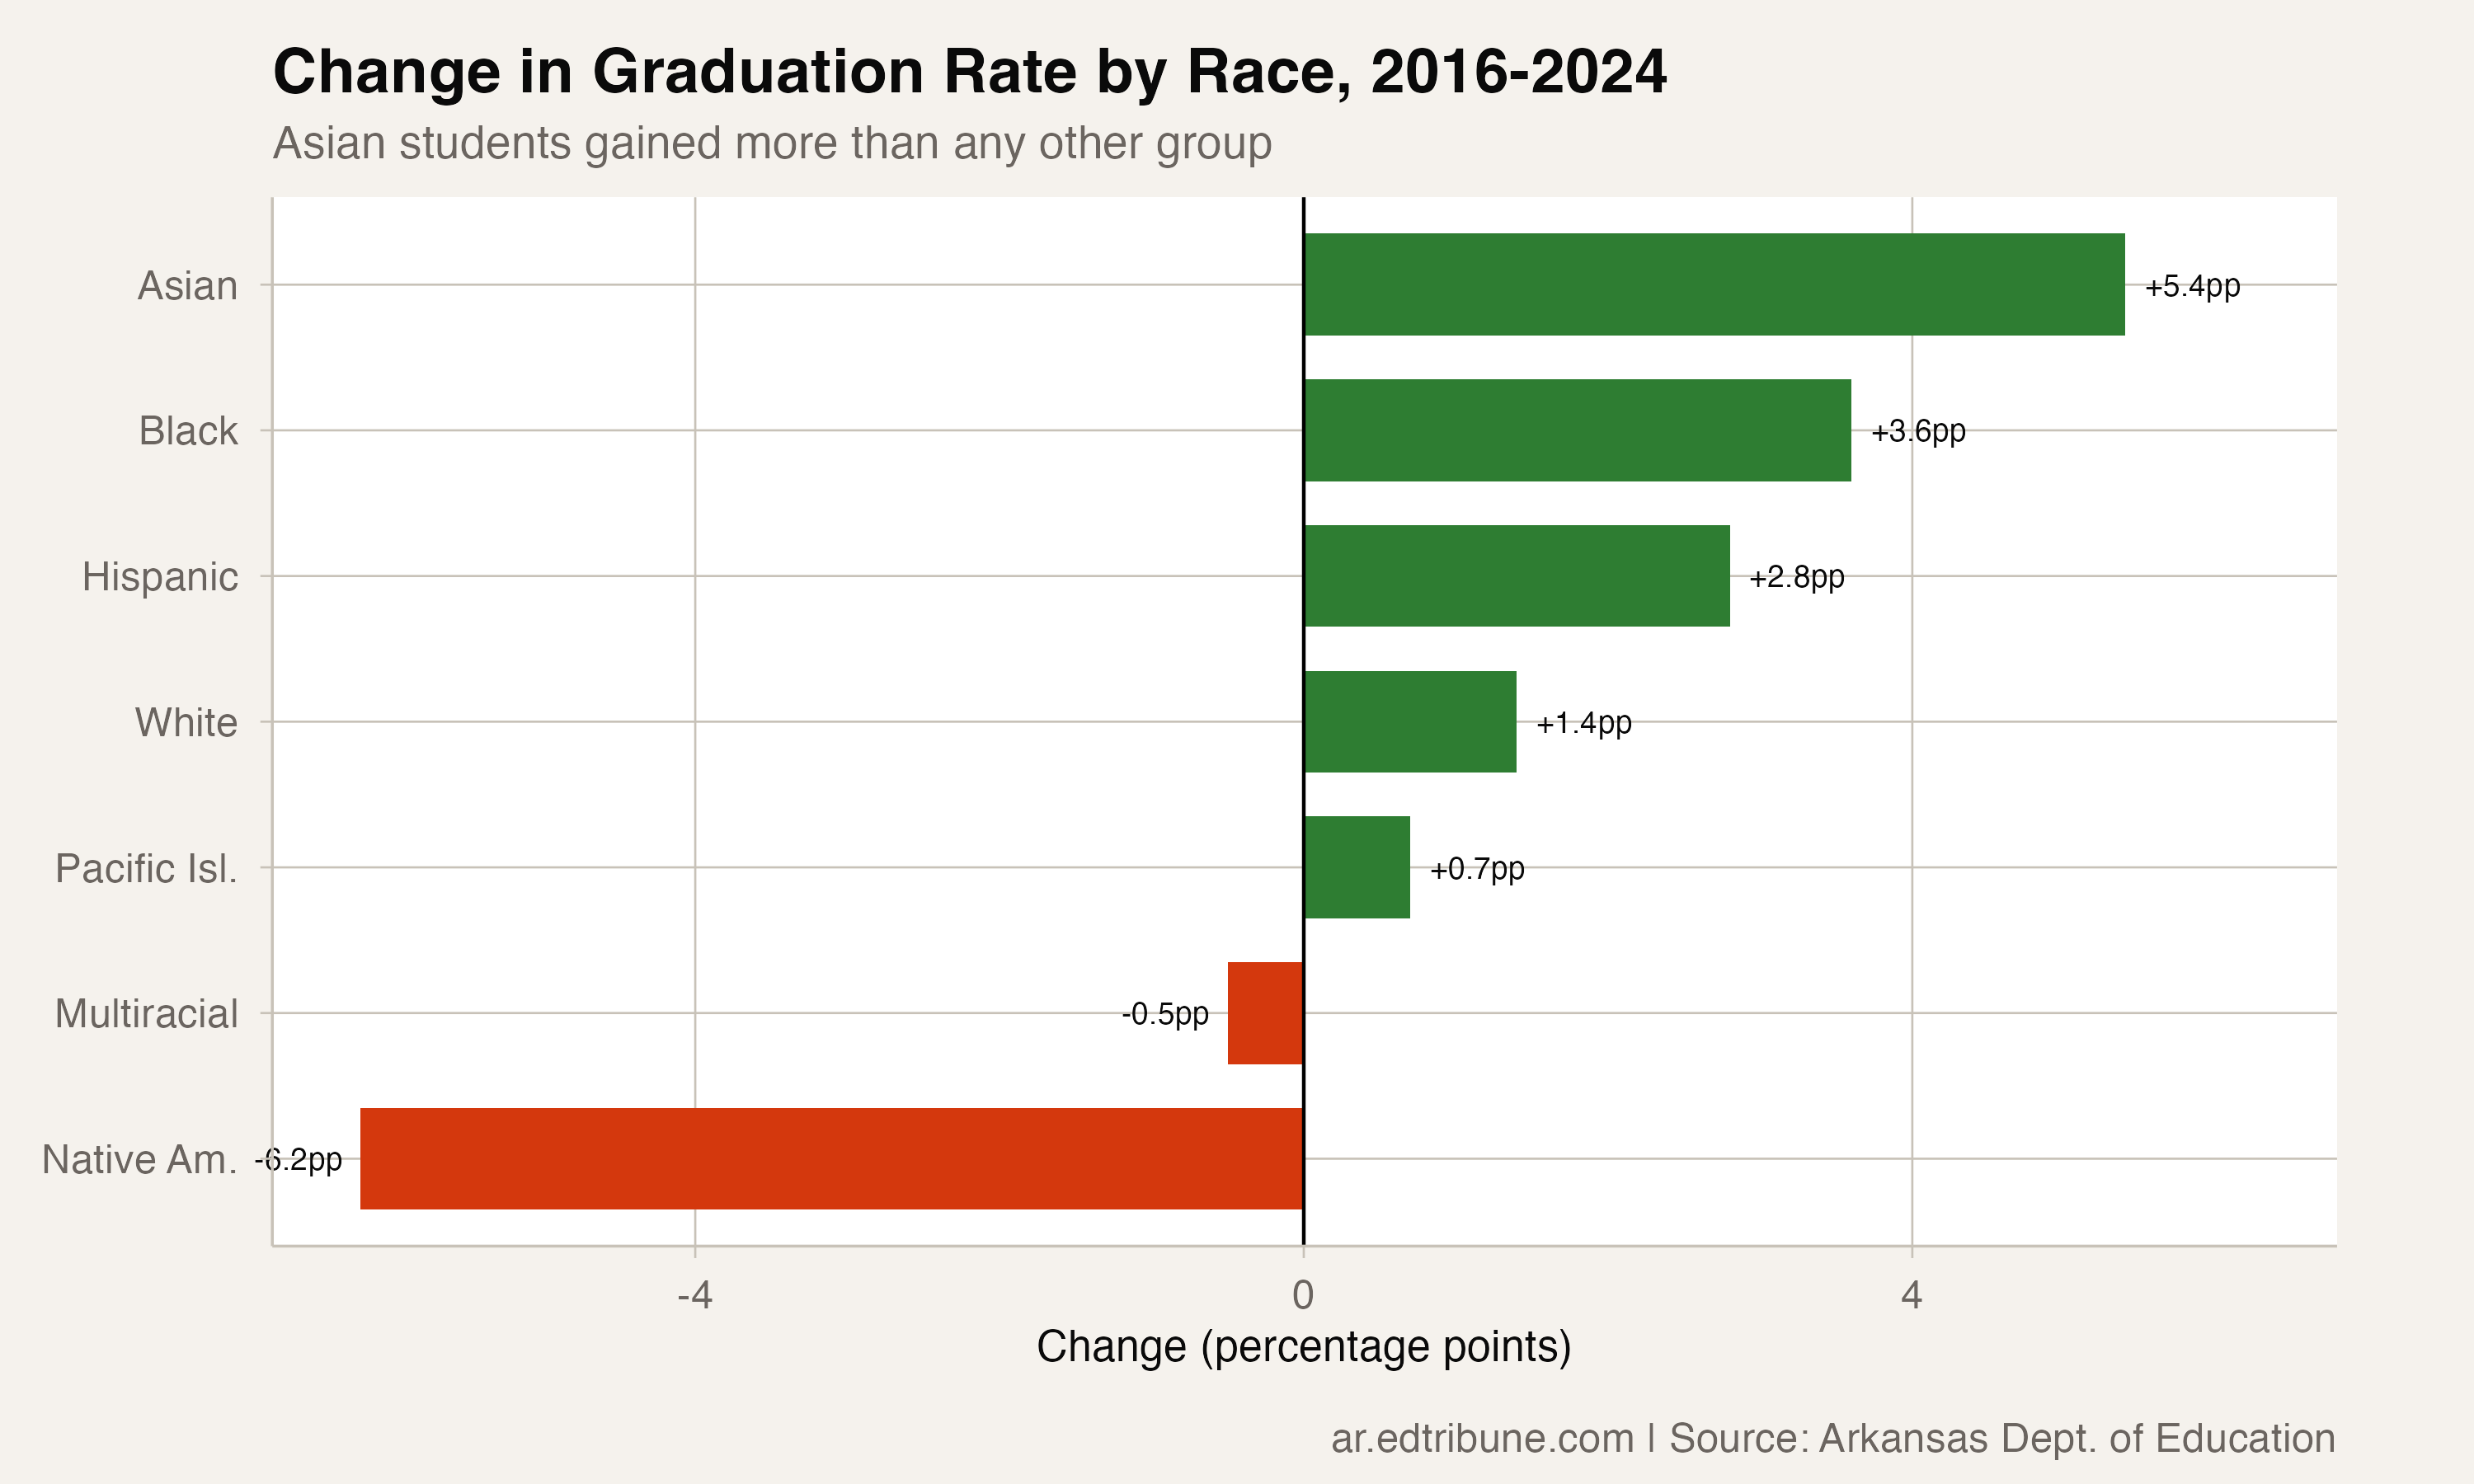
Asian students gained 5.4 points. Black students gained 3.6. Hispanic students gained 2.8. White students gained 1.4. Native American students lost 6.2 points, a decline driven partly by the very small population size, which amplifies year-to-year swings.
The pattern is clear: the groups with the most room to grow made the largest gains, while the group already at the top (white students) grew least. This convergence is the positive version of the "regression to the mean" story, rising floors rather than falling ceilings.
What 96 Percent Looks Like
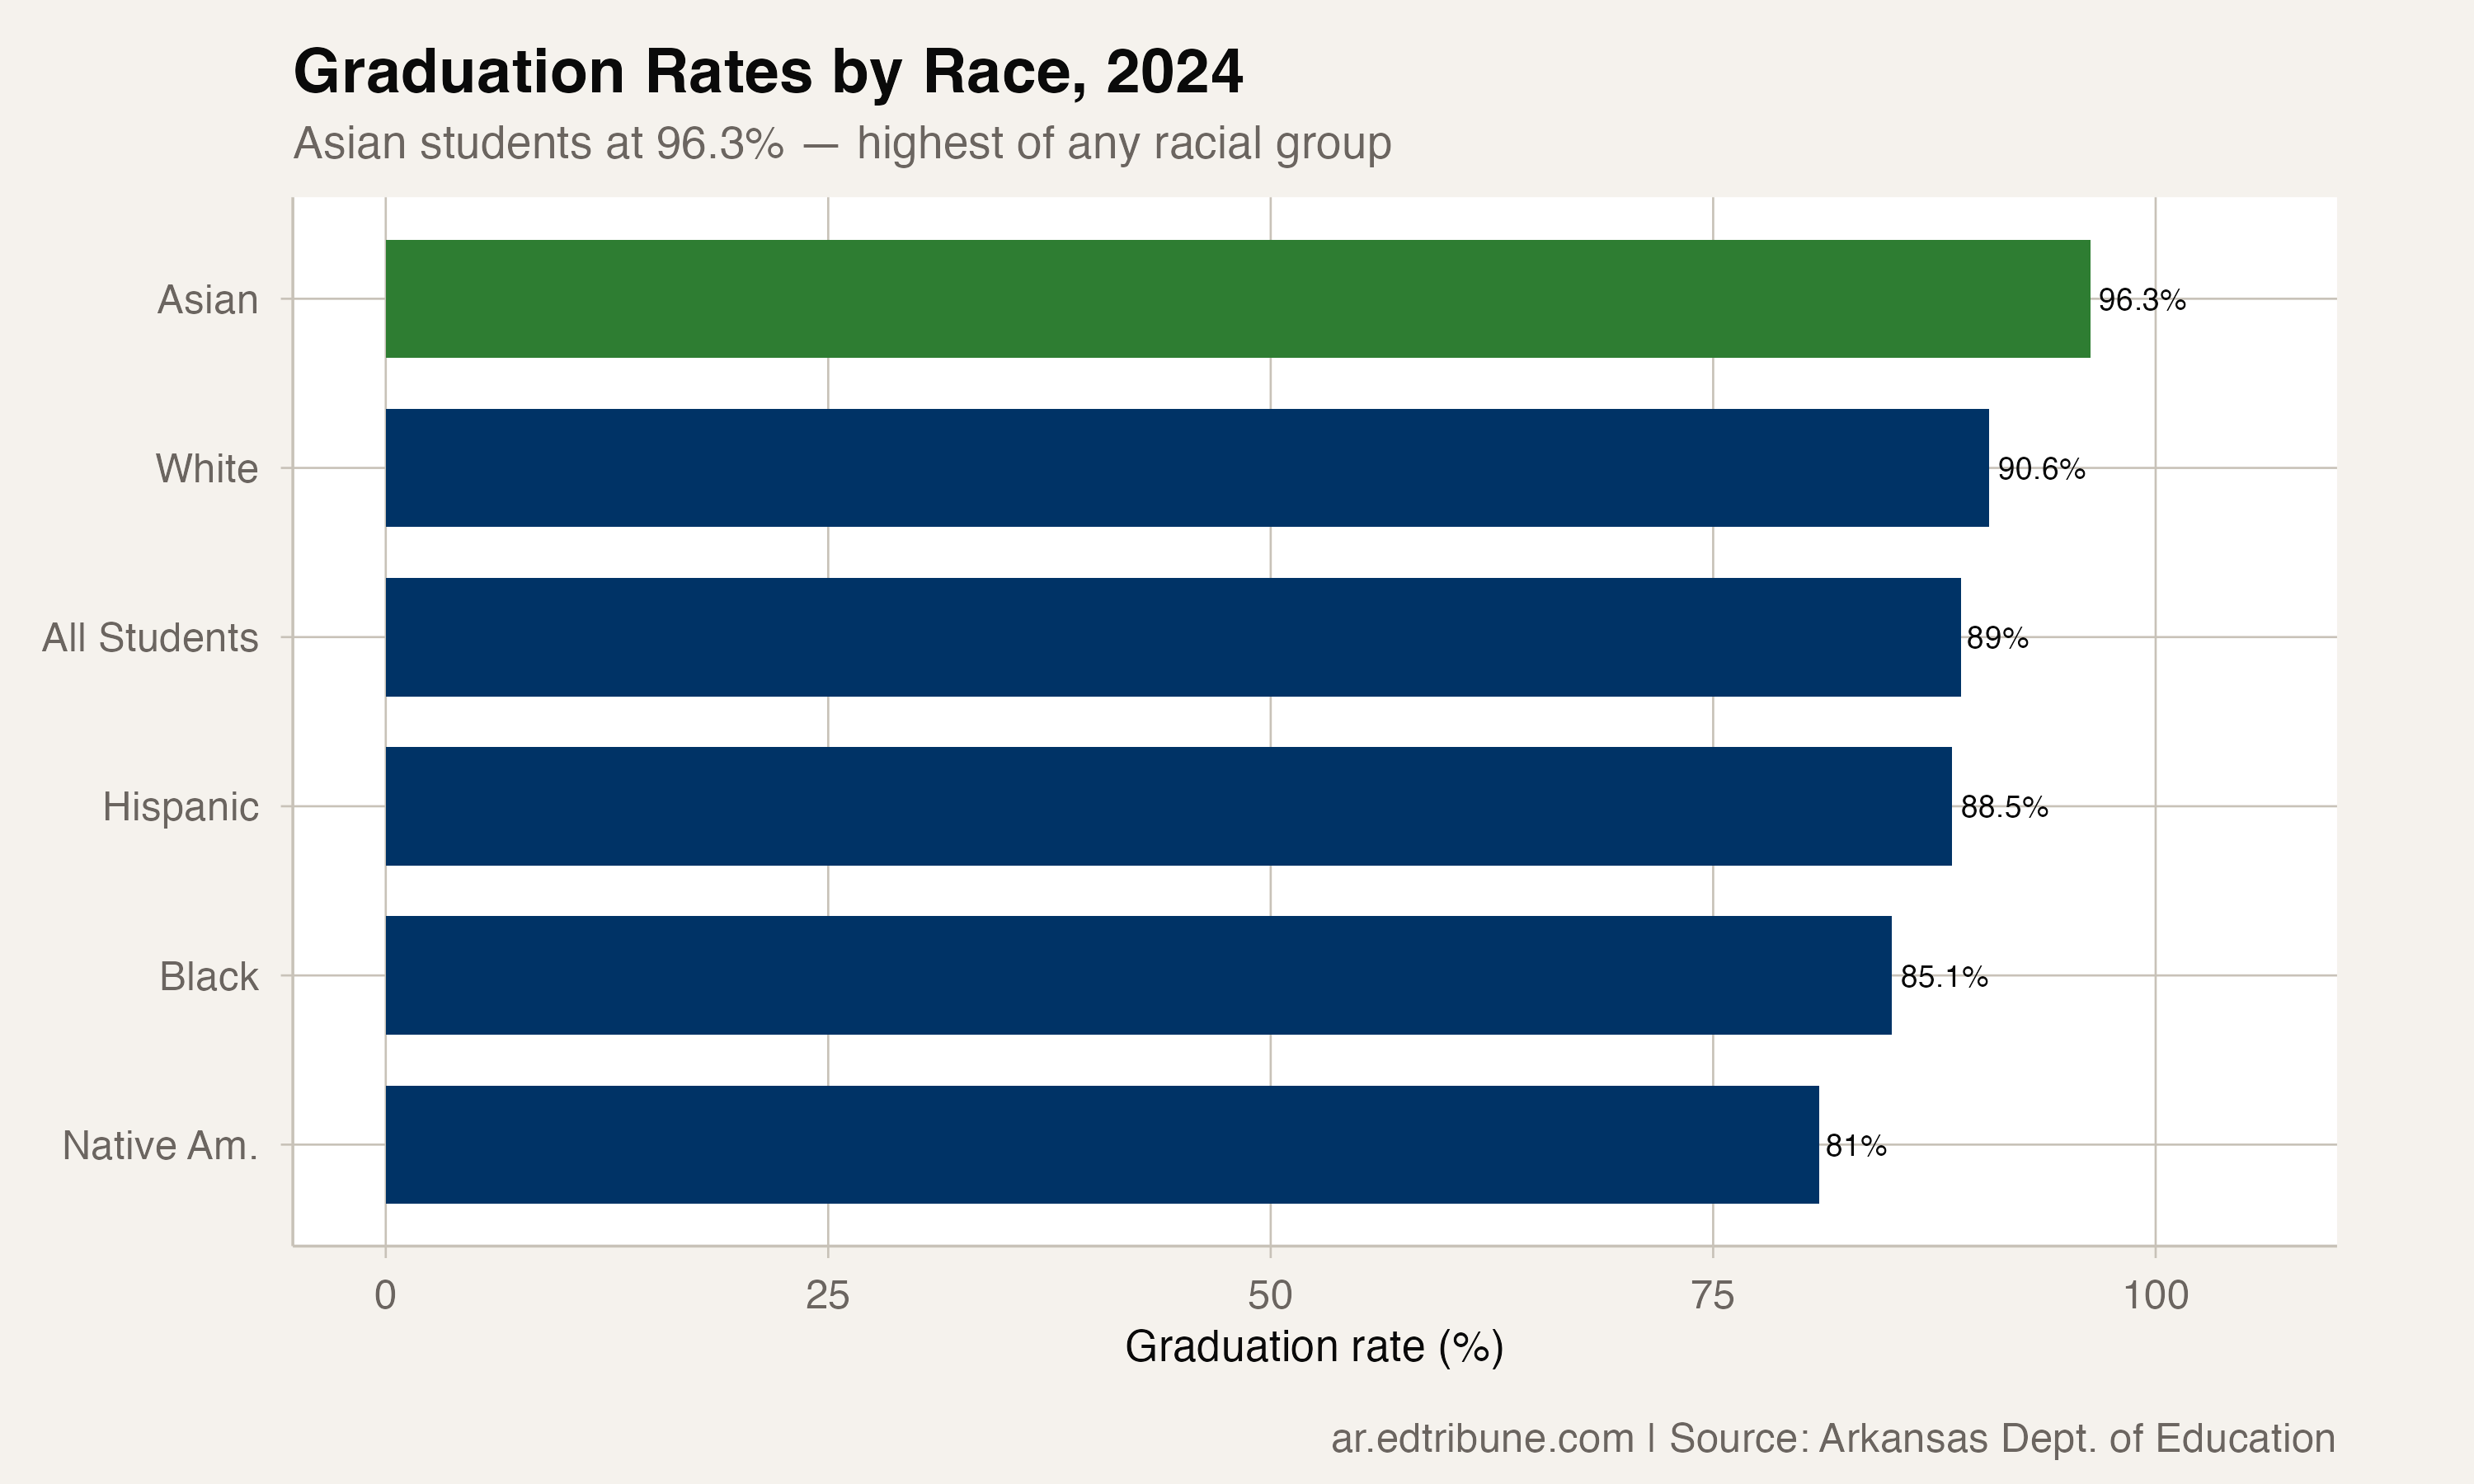
At 96.3 percent, Asian students in Arkansas graduate at a rate that most districts, not subgroups but districts, never reach. The state caps reported district rates at 95 percent, and 70 districts sit pinned at exactly that ceiling. Only one district in the state edges above it.
The number raises a question about how much higher the rate can go. A 96.3 percent rate means roughly 4 in 100 Asian students do not graduate on time. Some of those students are recent immigrants still acquiring English. Some face family circumstances that pull them out of school. At some point, the remaining students who do not graduate face barriers that school systems alone cannot address.
By the numbers: Asian students graduated at 96.3% in 2024, up 5.4 points from 90.9% in 2016. The gap between Asian and white students widened from 1.7 to 5.7 points, in Asian students' favor.
Detailed code that reproduces the analysis and figures in this article is available exclusively to EdTribune subscribers.
Discussion
Sign in to join the discussion.
Loading comments...