In 2010, three Arkansas school districts had multiracial students exceeding 5% of enrollment. In 2025-26, 82 do. Eleven districts are above 10%. The category barely existed in the data 16 years ago.
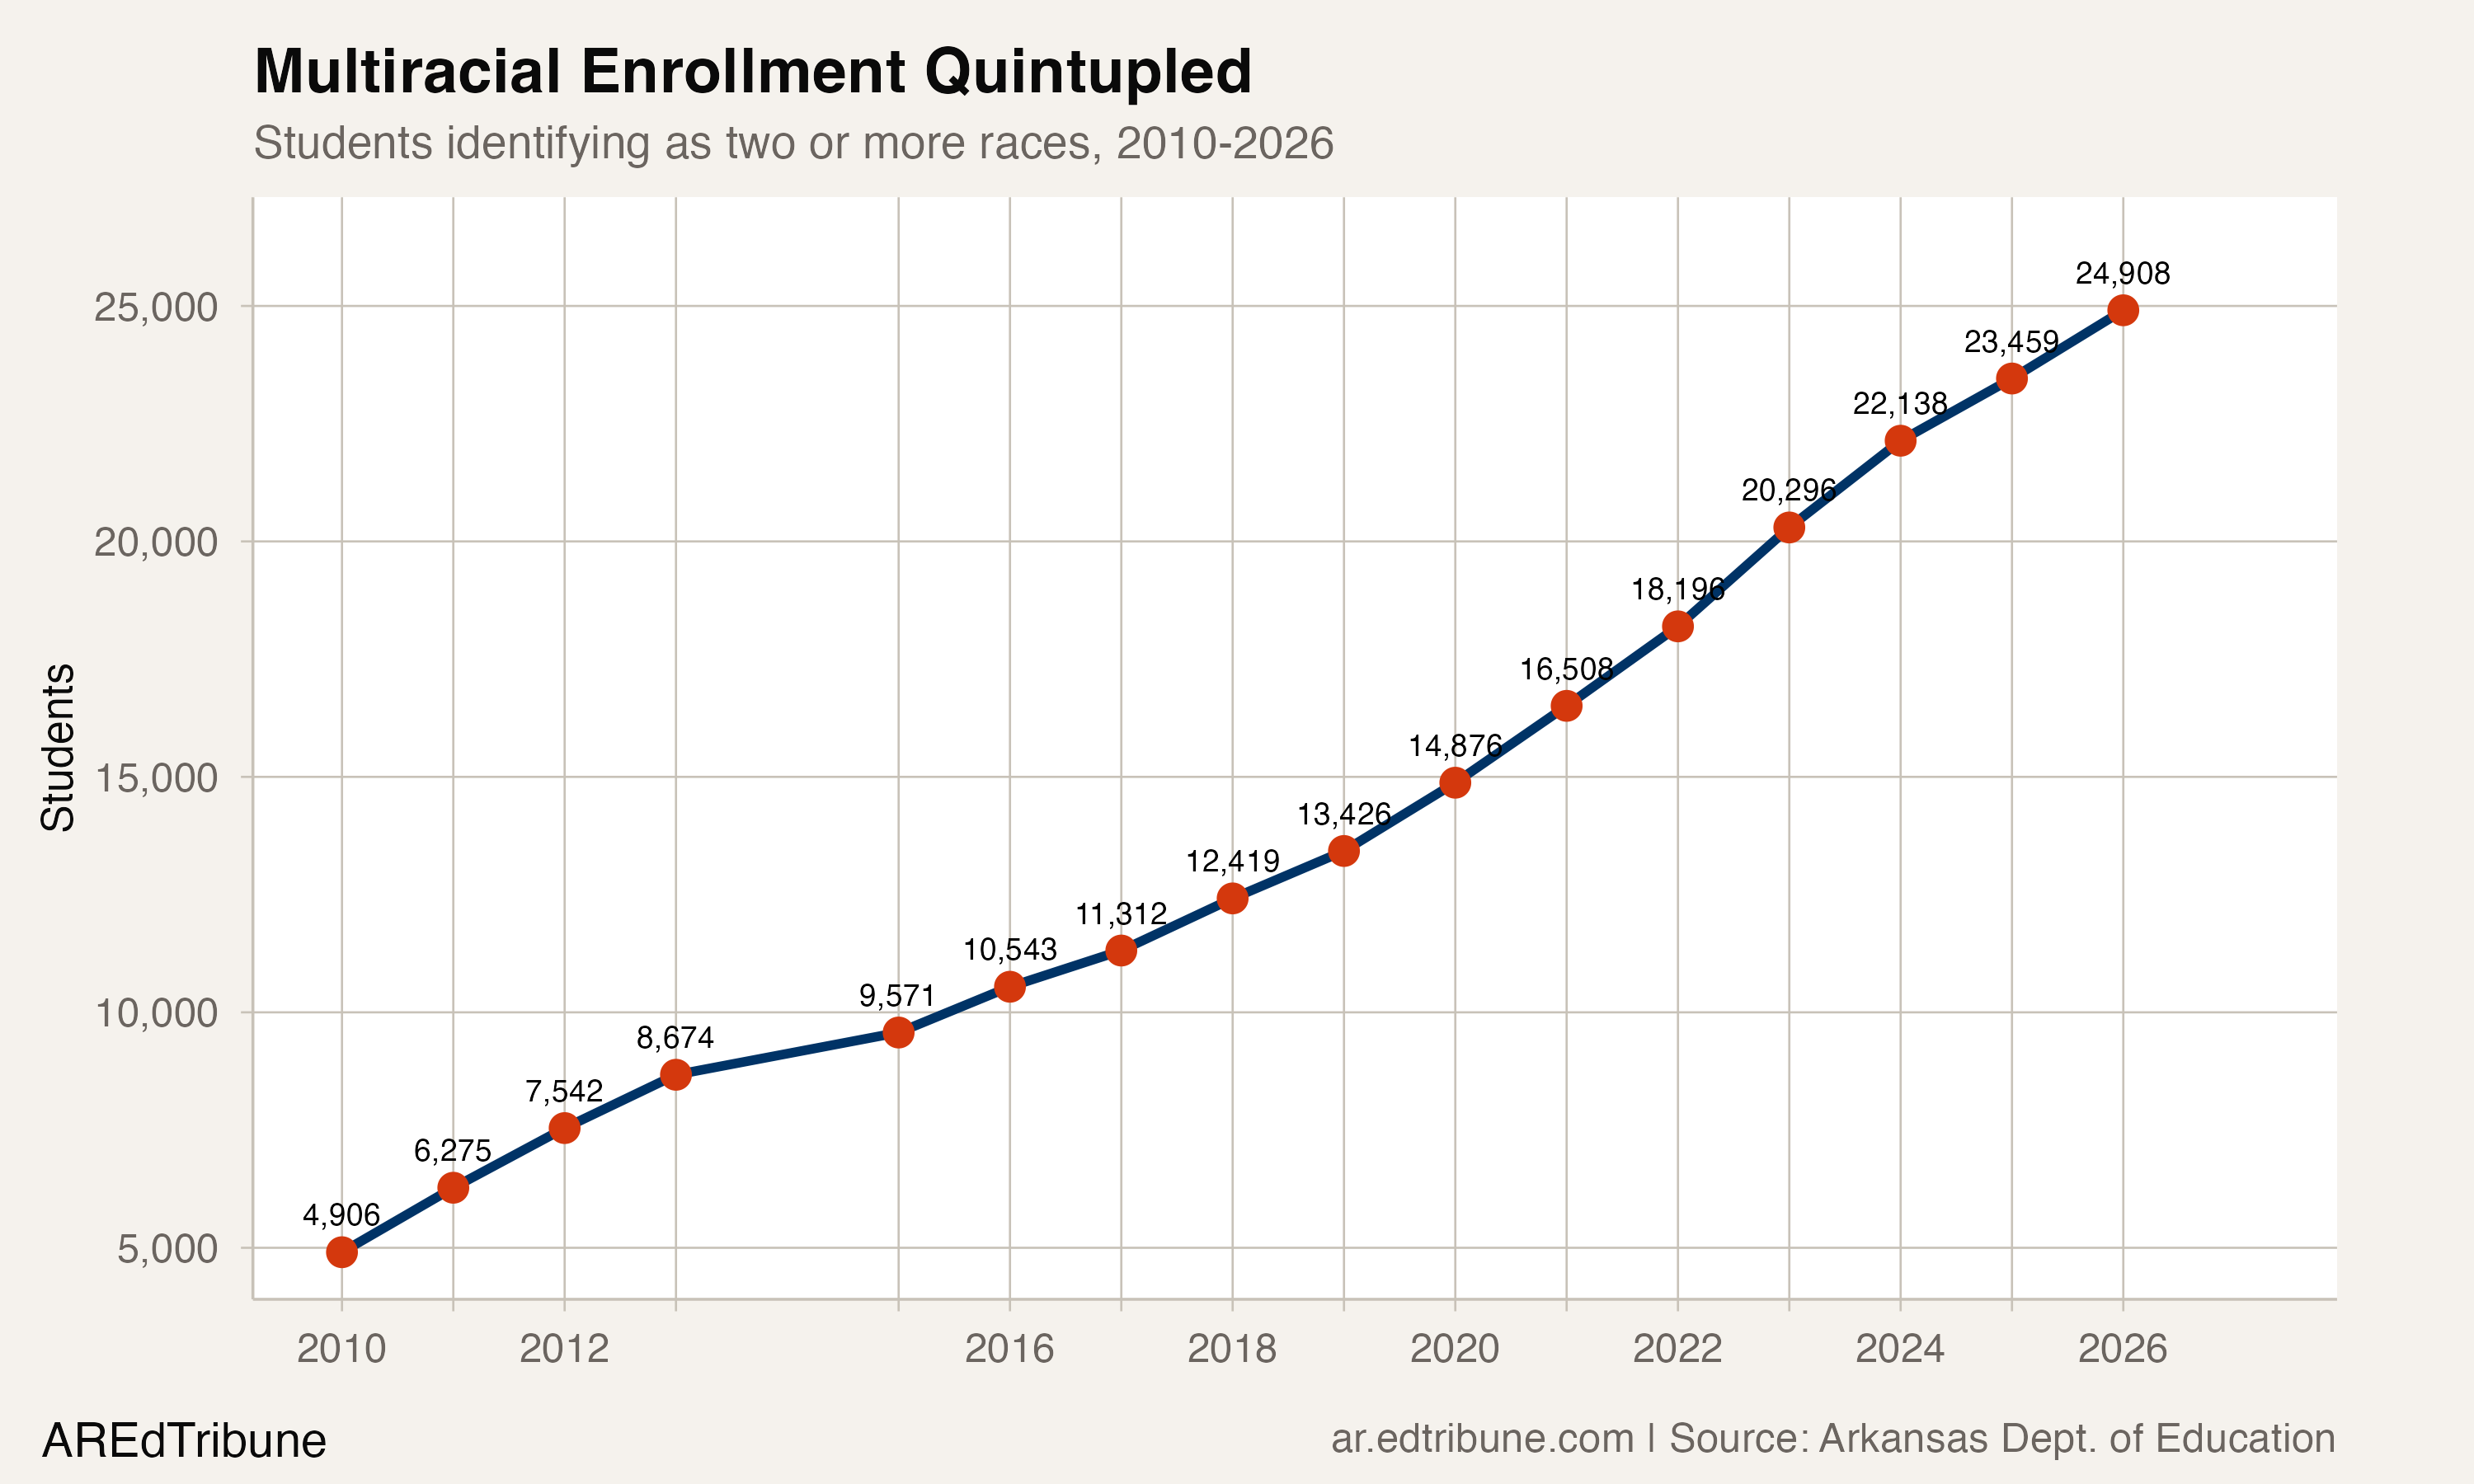
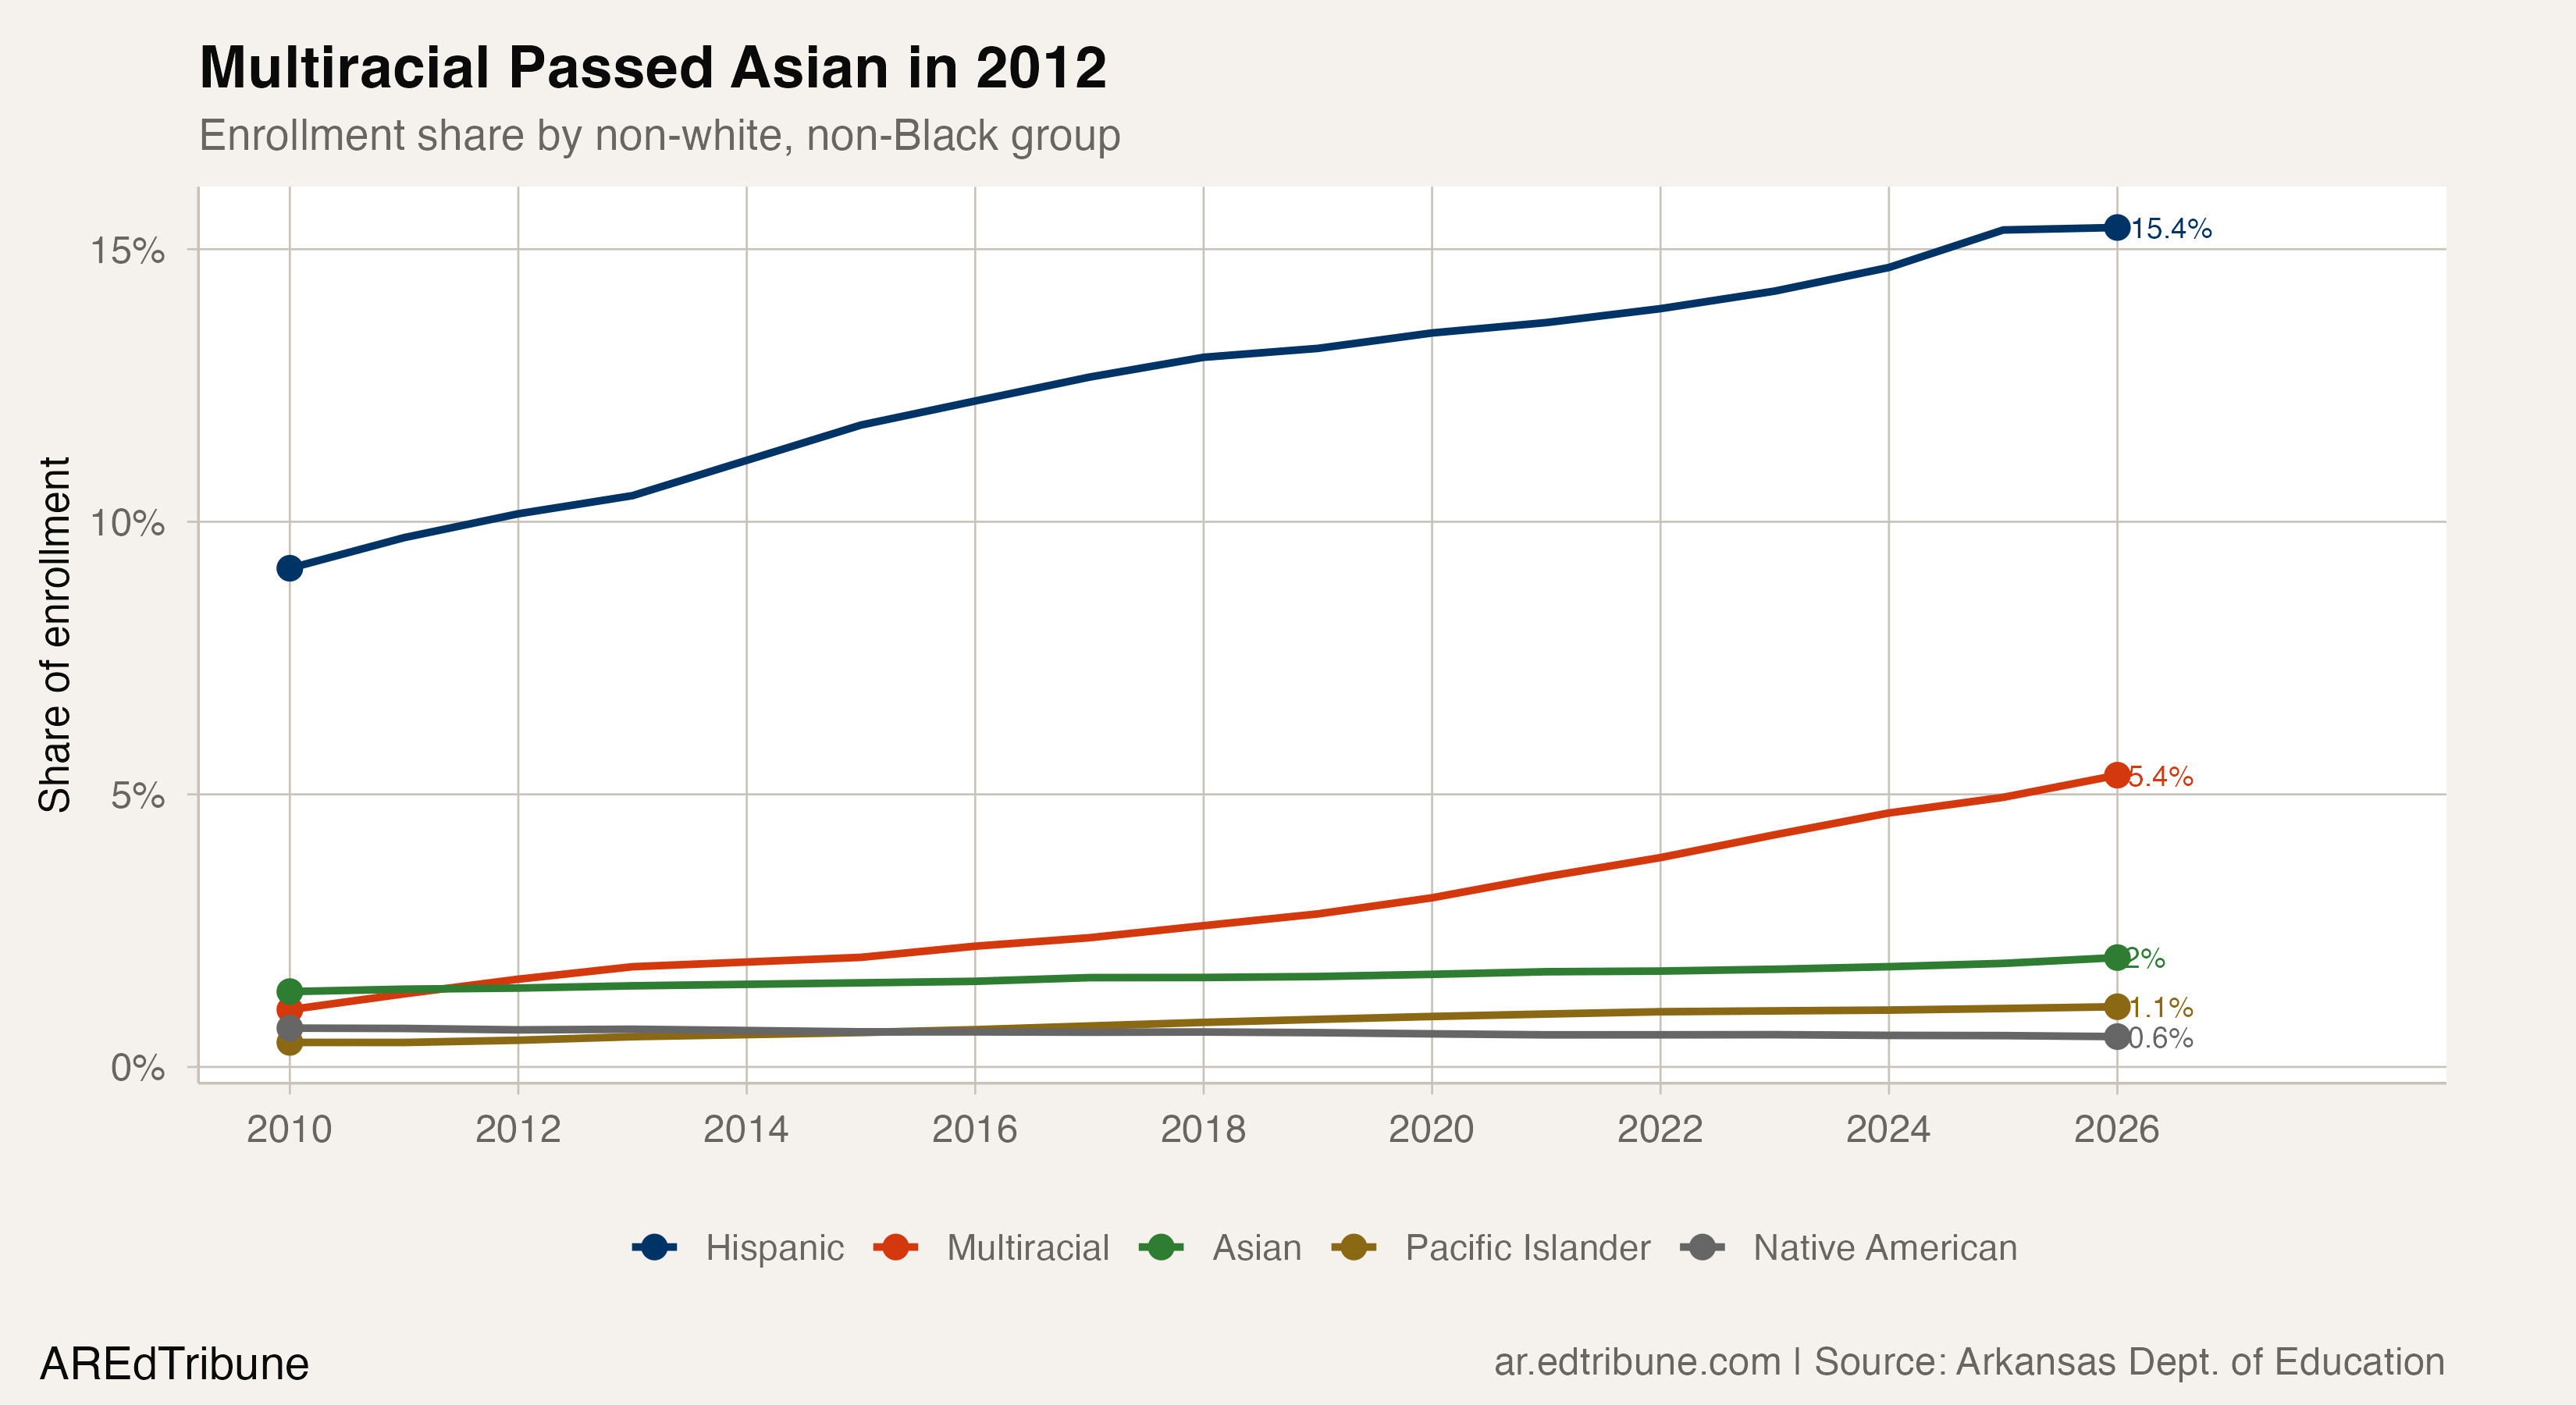
Arkansas's two-or-more-races student population has grown from 4,906 to 24,908 since 2010, a 407.7% increase. Hispanic enrollment, the next-fastest grower, rose 67.7% over the same period. Multiracial students now represent 5.4% of statewide enrollment, up from 1.1%, and the group is larger than Asian, Native American, and Pacific Islander students combined.
But that 408% headline requires an asterisk. The category's early growth is tangled with a federal reporting change that makes the true rate of demographic shift hard to isolate.
A new checkbox on the form
The U.S. Department of Education required all schools to adopt new race and ethnicity categories beginning in 2010-11, allowing students to identify with two or more races for the first time. Before that, multiracial students were slotted into a single category. Arkansas districts adopted the new categories unevenly: in 2010, 89 of 265 districts, one-third of the state, reported zero multiracial students. By 2013, that dropped to 48. By 2026, only six districts still report zero.
The early growth, roughly 2010 to 2015, was partly an artifact of districts catching up to the new reporting standard. Families who had previously checked a single box were re-surveyed and given the option to select multiple races. That alone moved students into the multiracial column without a single new enrollment.
The more telling period is 2021 to 2026, when reporting practices had largely stabilized. In those five years, multiracial enrollment grew 50.9%, adding 8,400 students at an average of 1,680 per year. That growth rate, on a clean baseline, is still far faster than any other racial category in the state.
The growth is accelerating, not plateauing
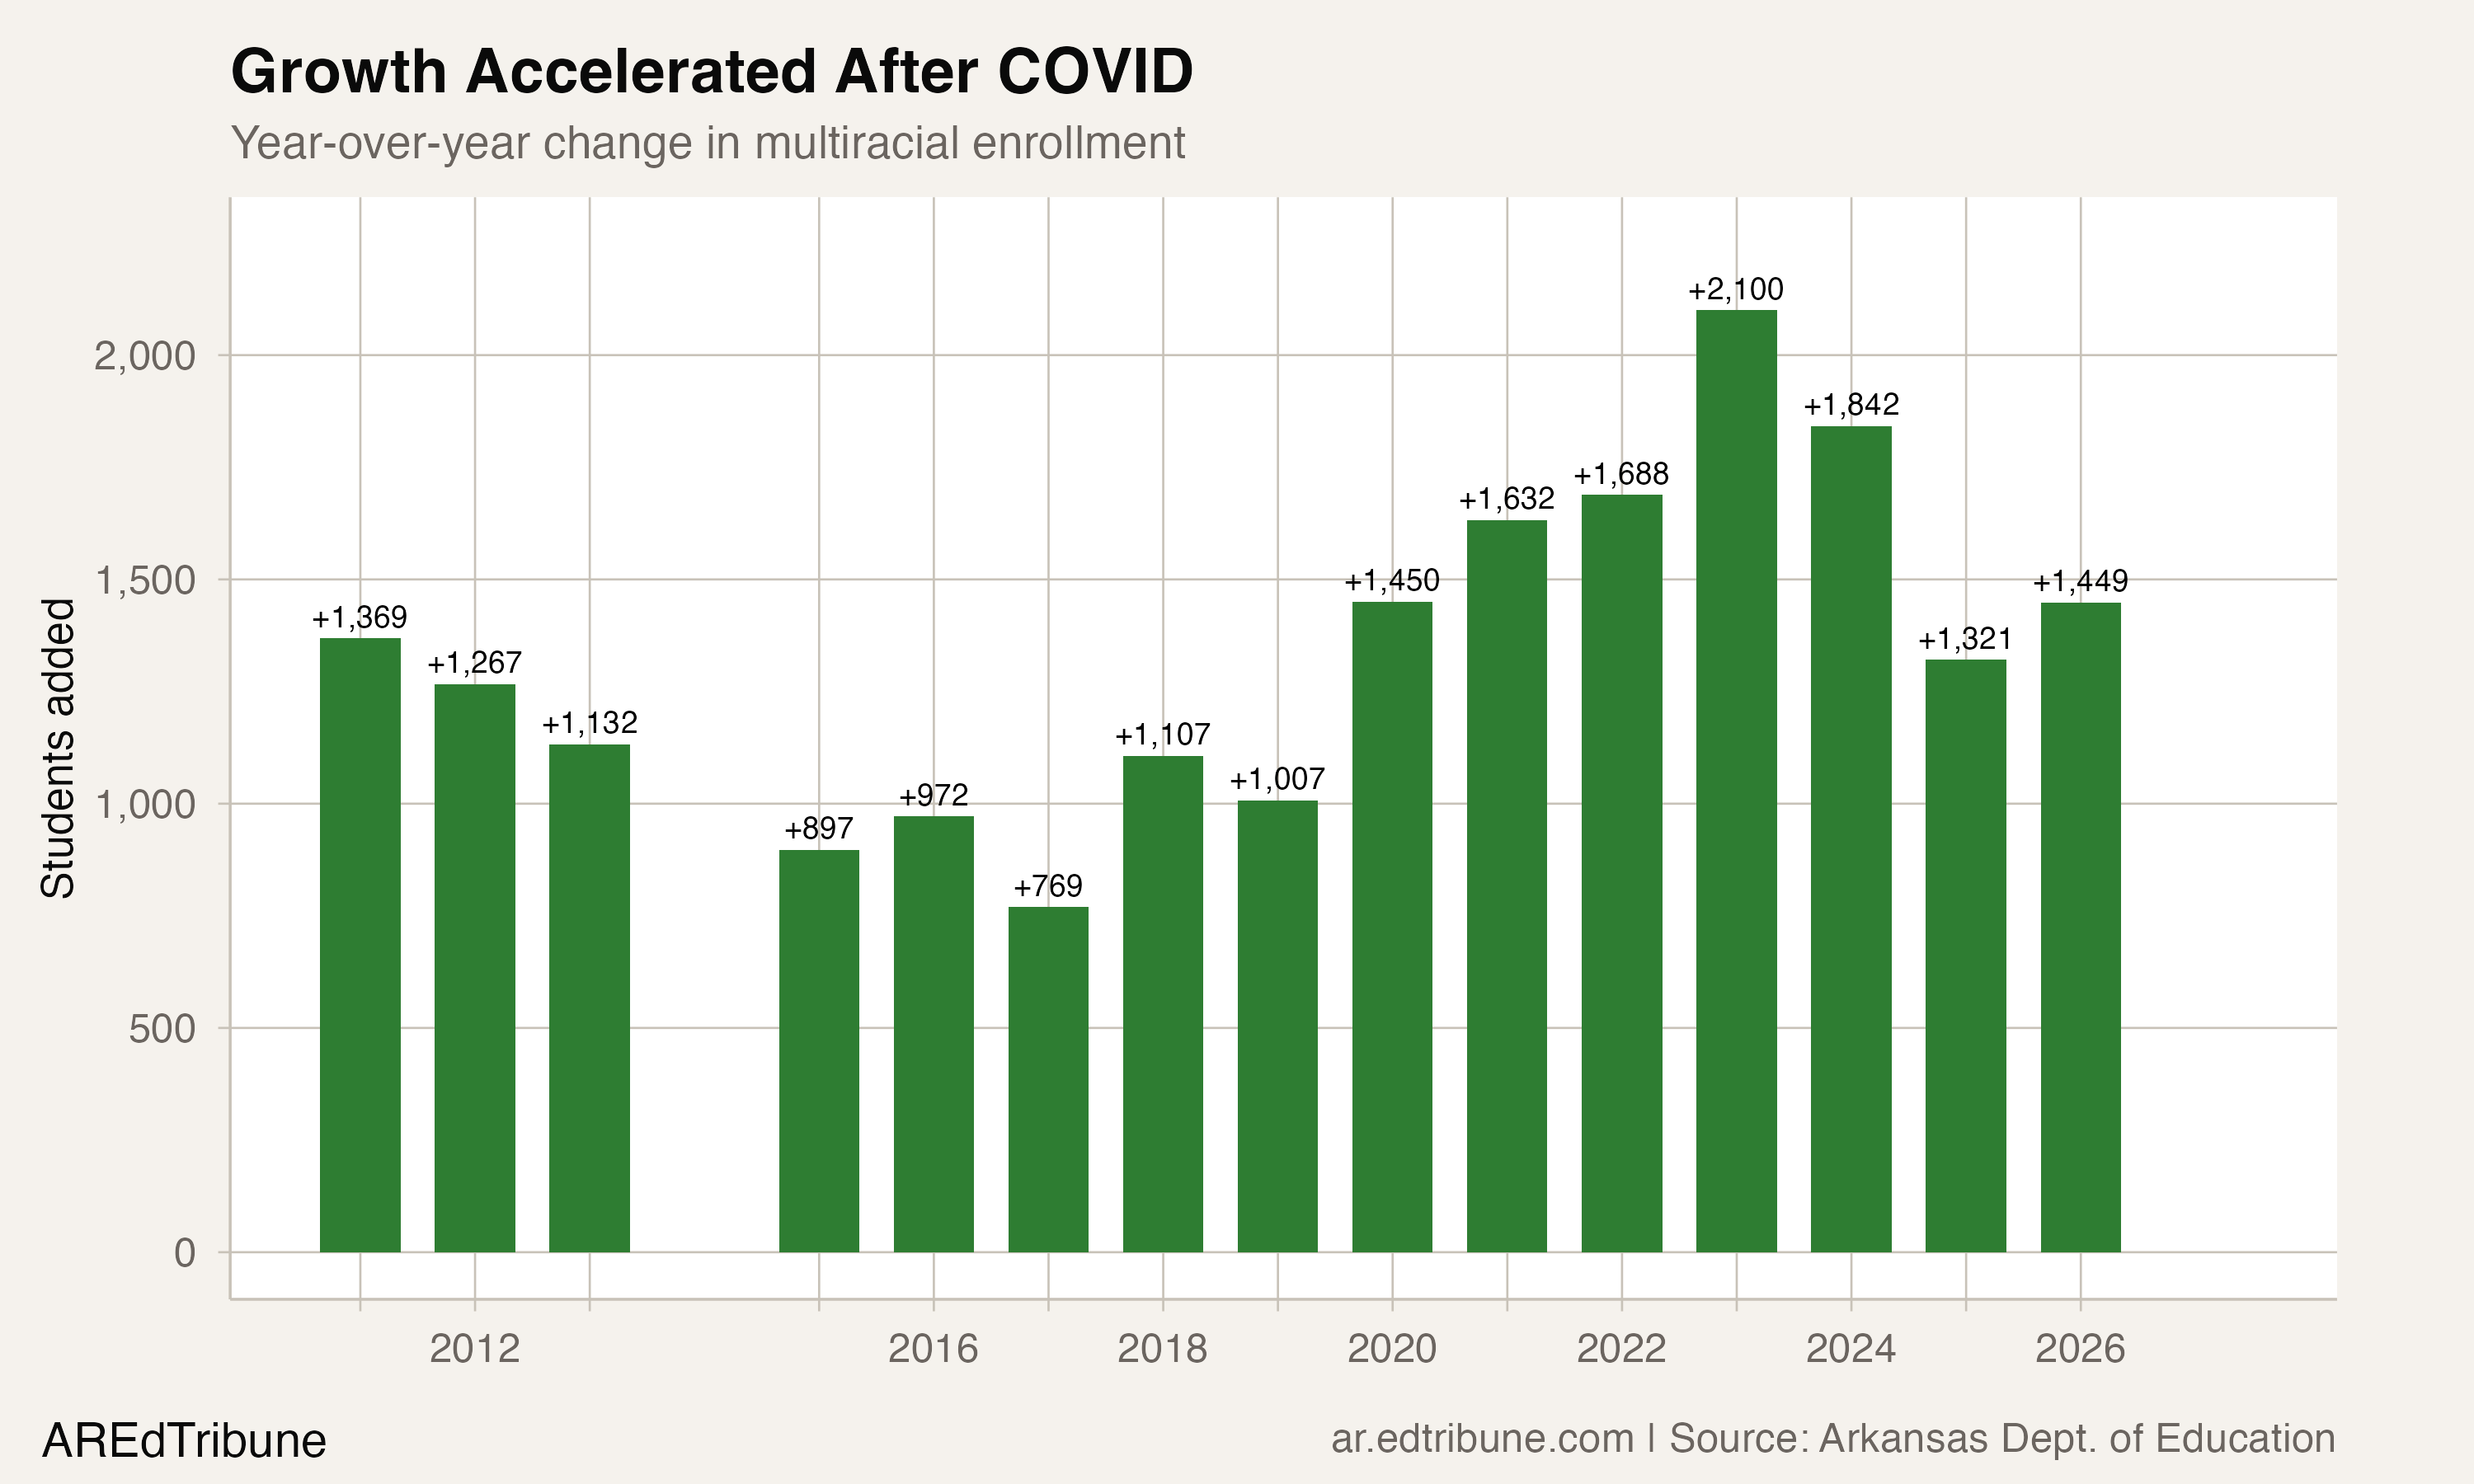
Year-over-year additions show a category that keeps gaining speed. In 2017, Arkansas added 769 multiracial students. In 2023, it added 2,100, the single largest annual gain on record. The 2024-2026 additions of 1,842, 1,321, and 1,449 have slowed from that peak but remain well above the pre-2020 pace.
Nationally, NCES data shows students of two or more races rose from 3% to 5% of U.S. public school enrollment between 2012 and 2022, with a projection of 6% by 2031. Arkansas's 5.4% share in 2025-26 is slightly above the most recent national figure.
The reclassification question
How much of this growth reflects new multiracial families enrolling their children, and how much reflects existing families re-identifying? The data cannot distinguish the two.
Princeton sociologists Paul Starr and Christina Pao found that the 276% increase in multiracial Americans in the 2020 Census was substantially driven by methodology, not demographics. A computerized algorithm reclassified respondents who marked a single race but wrote in certain origins as multiracial, even though they had self-identified as one race.
"The 2020 census produced a sudden jump in the multiracial count and a precipitous decline in the count of the white population, contributing to an unwarranted panic among white conservatives about demographic change." — Fortune, Jan. 2025, citing Princeton researcher Paul Starr
School enrollment data uses a different collection mechanism than the Census. Parents fill out enrollment forms directly, and districts report what families select. There is no algorithmic reclassification. Still, the same cultural forces that made multiracial identification more common on Census forms likely influence how parents fill out school enrollment paperwork.
The strongest evidence that real demographic change is at work, not just reclassification, is the geographic pattern.
Northwest Arkansas is the epicenter
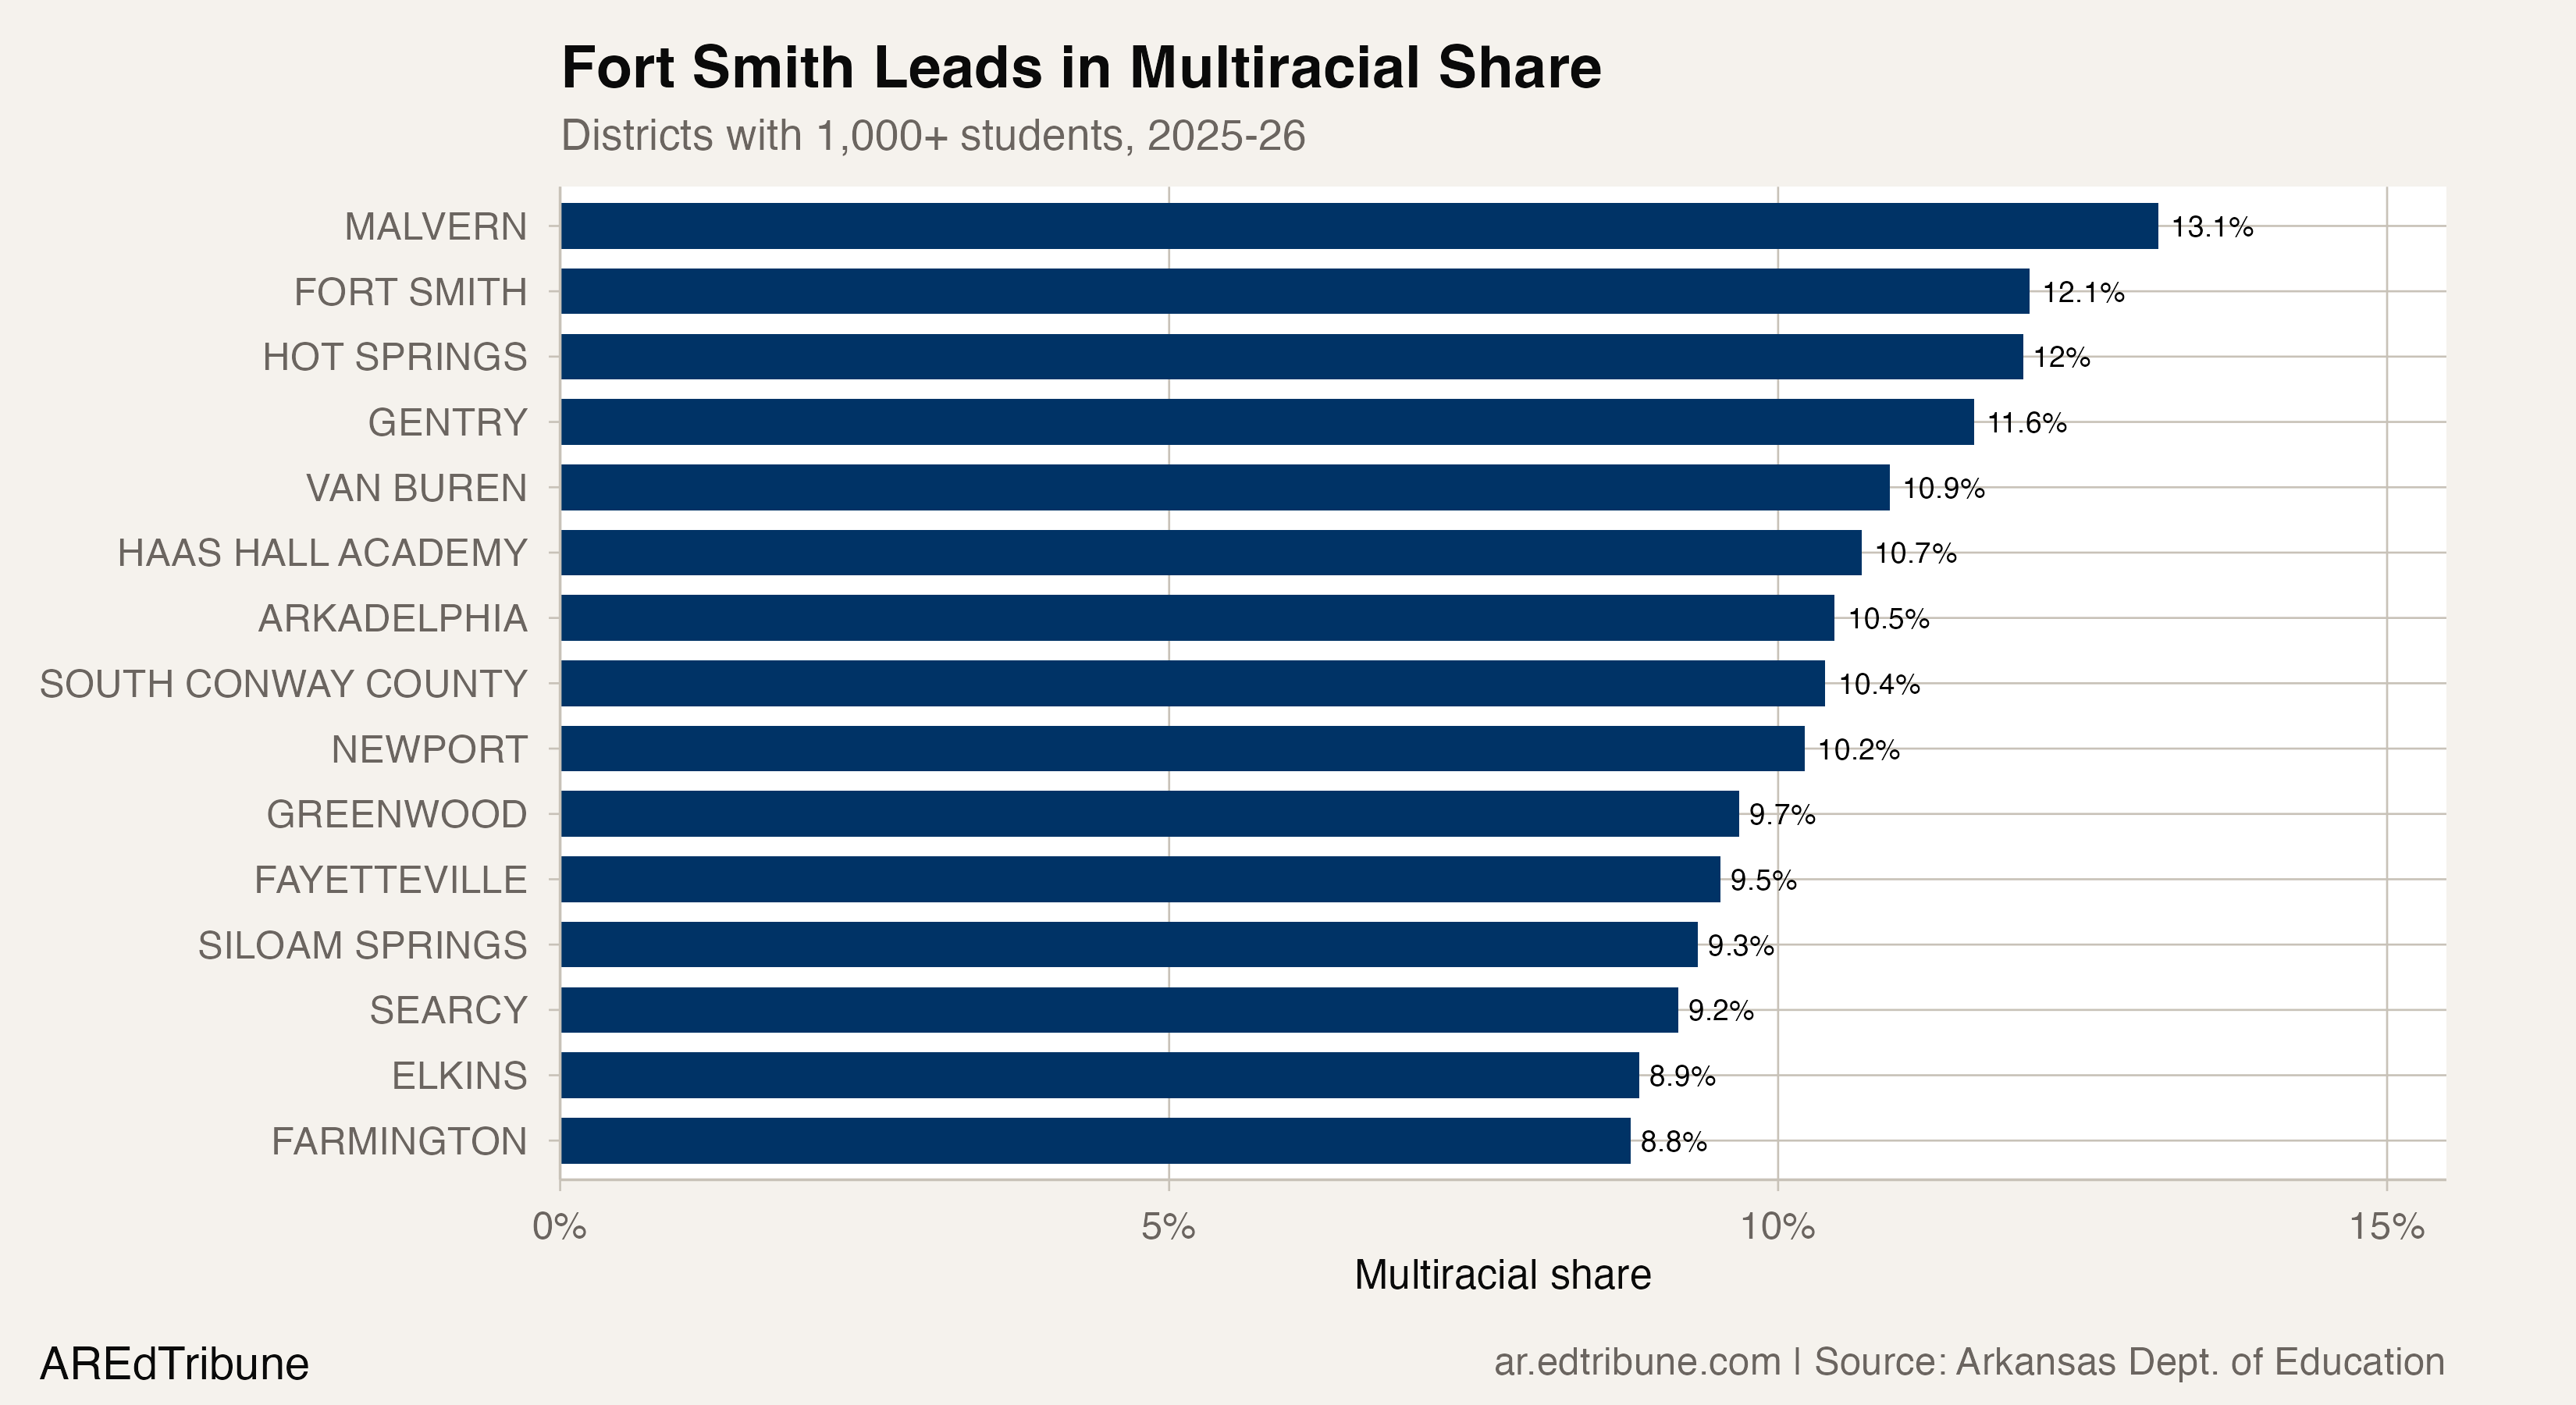
Fort Smith↗ET leads all large districts with a 12.1% multiracial share, 1,593 students in a district of 13,205. But the growth is spread across the state's fastest-growing corridor. Fayetteville↗ET went from 82 multiracial students in 2010 (1.0% of enrollment) to 969 in 2026 (9.5%), an increase of 887 students. Siloam Springs↗ET went from 26 to 400. Gentry↗ET went from 28 to 207.
Northwest Arkansas has been among the fastest-growing metro areas in the country, with Benton County growing 3% in a single year to 321,566 residents and Washington County adding 4,304 people to reach 266,184. The NWA Council reported that the region went from 95.4% white in 1990 to roughly 72% white by 2019, and had projected diverse populations would reach 31% by 2024.
That rapid diversification creates the conditions for multiracial families. A metro area that was nearly homogeneous a generation ago now has substantial Hispanic, Pacific Islander, and Asian communities alongside its white majority.
Central Arkansas suburbs tell the same story
The pattern extends beyond NWA. Conway↗ET went from 19 multiracial students in 2010 to 774 in 2026, an 8.1% share. Cabot↗ET went from zero to 820, also 8.1%. Pulaski County Special School District↗ET went from zero to 809, a 7.0% share. Hot Springs↗ET reached 12.0%.
Some of those 2010 zeros were clearly a reporting lag, not a demographic reality. Cabot, a suburban district of 10,150 students, did not have literally zero multiracial children in 2010. It had not yet adopted the new form. But the trajectory since, from 20 in 2011 to 820 in 2026, represents a real and sustained increase even after the initial reporting bump.
The composition shift underneath
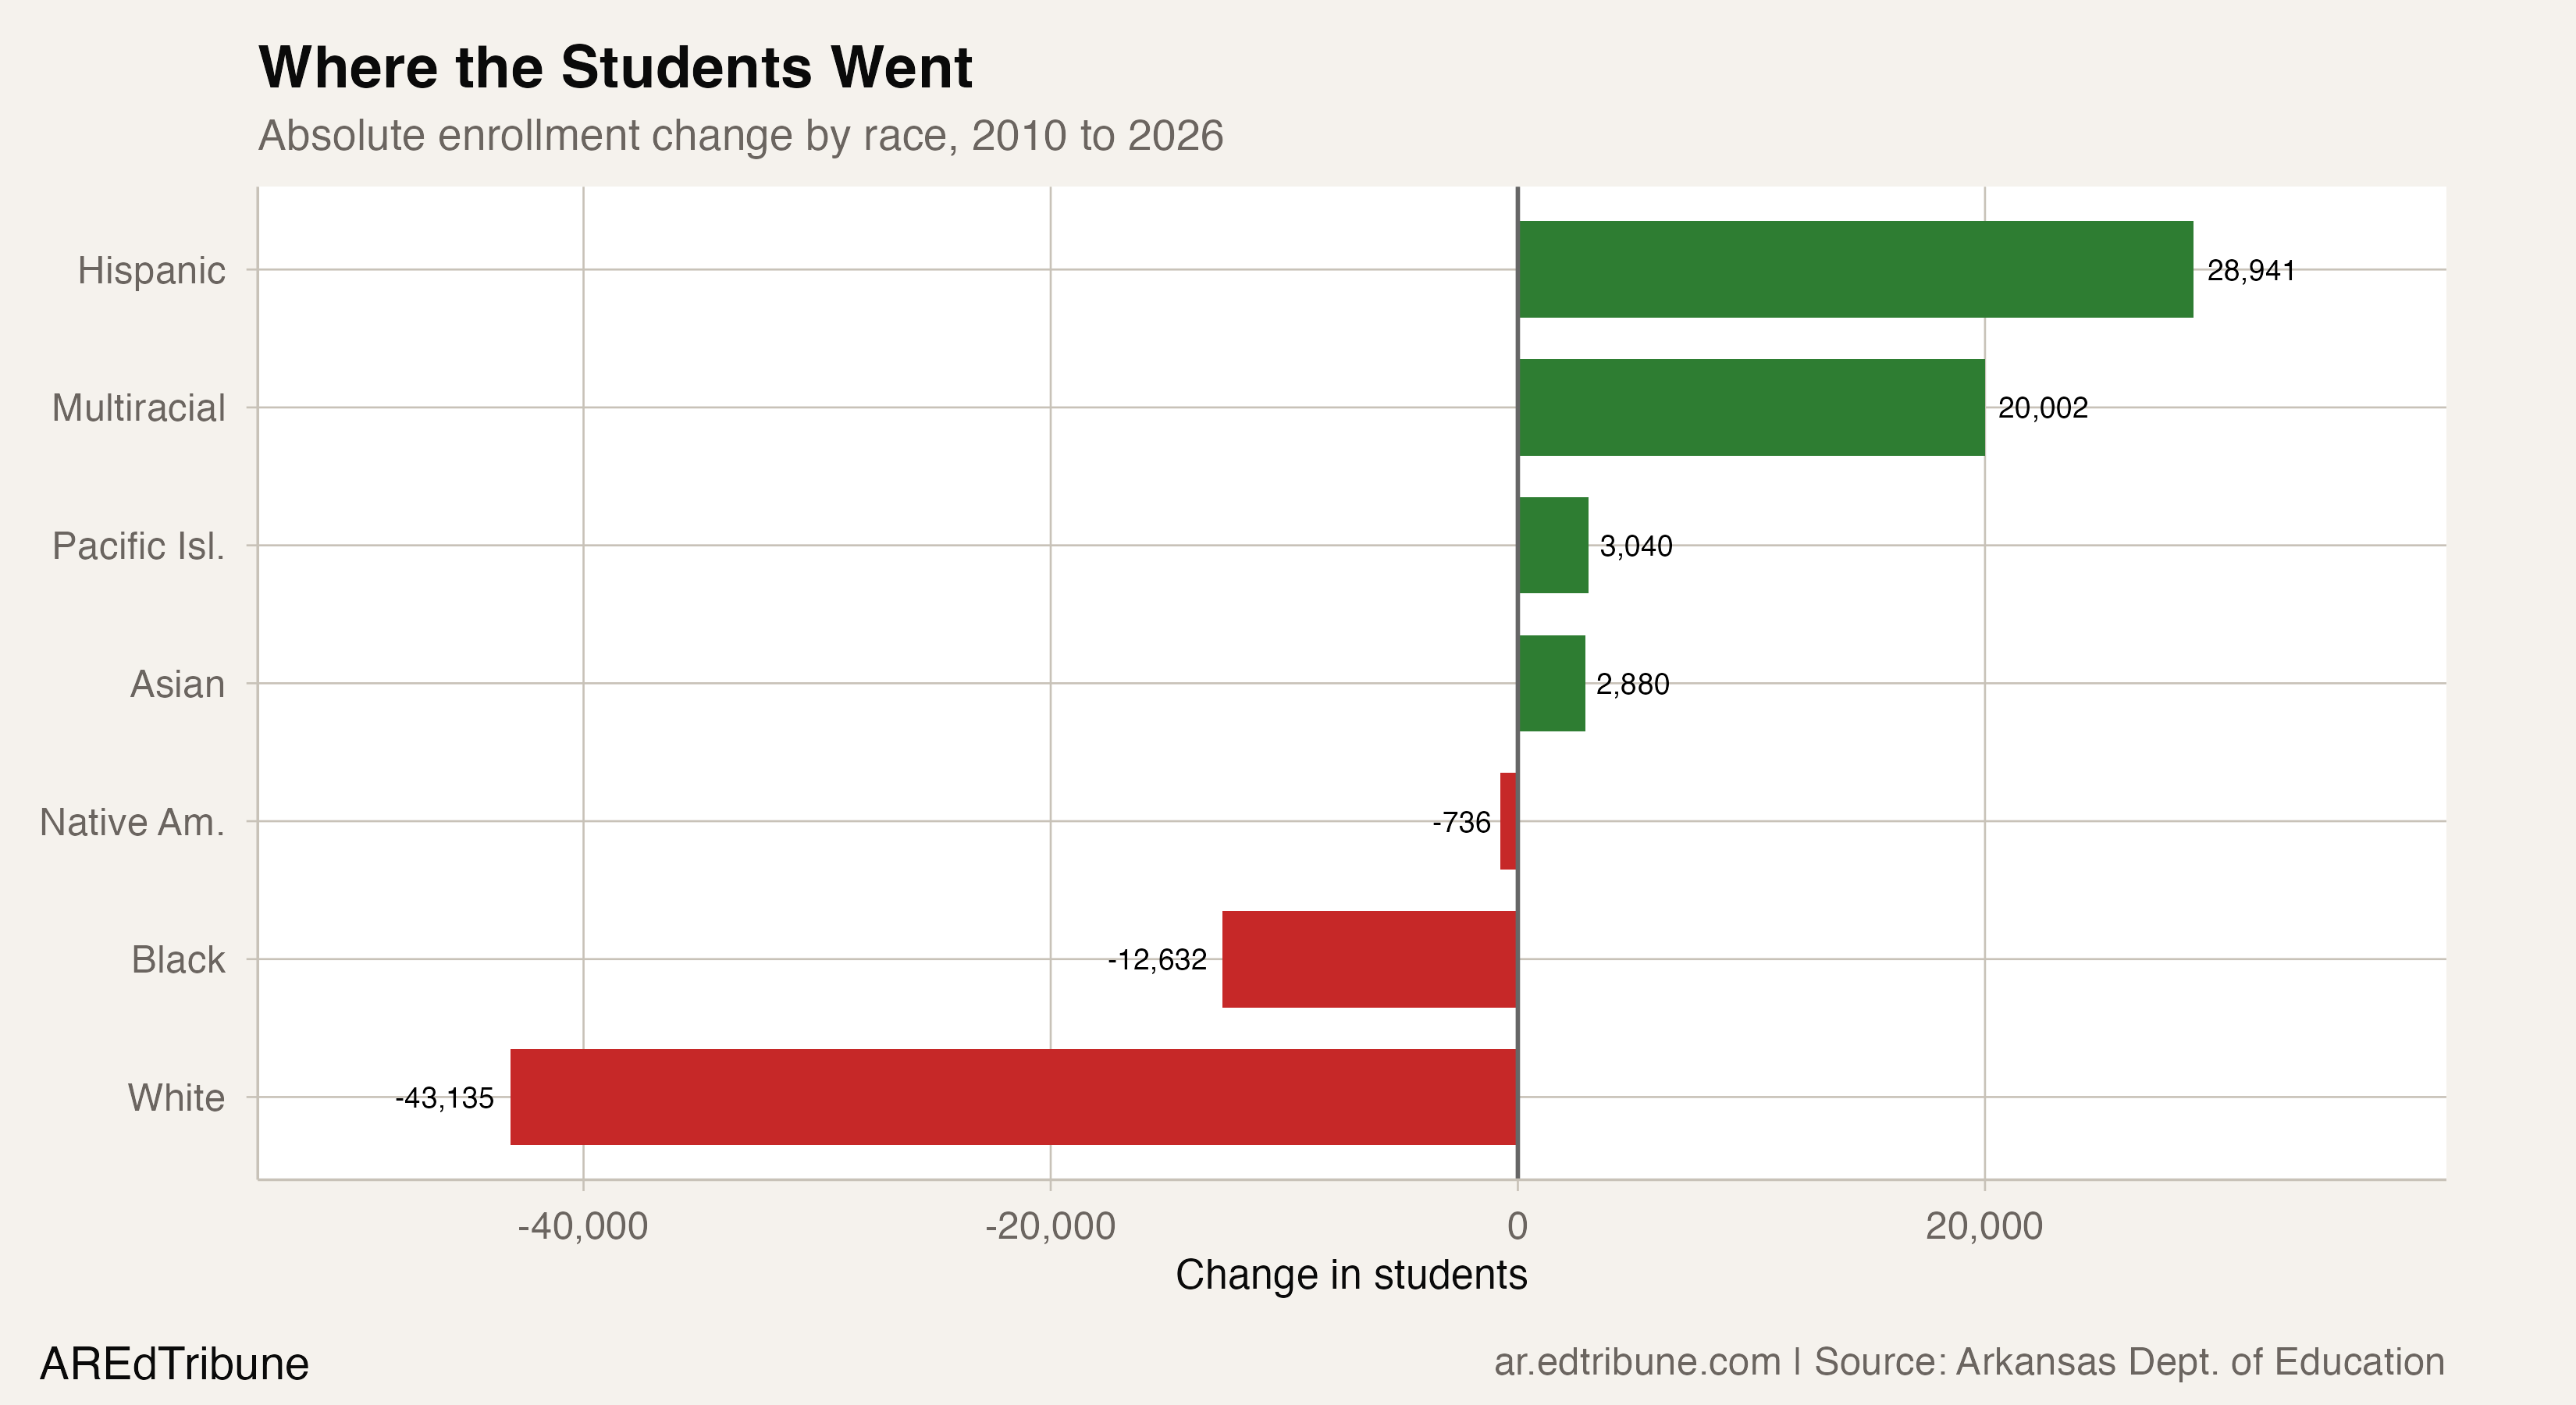
The multiracial surge is part of a broader rebalancing. Since 2010, Arkansas's white enrollment has fallen by 43,135 students (14.1%) and Black enrollment by 12,632 (12.5%). Hispanic enrollment grew by 28,941 (67.7%). The multiracial category added 20,002 students, the second-largest absolute gain after Hispanic.
In the most recent five-year window, multiracial growth offset 42.4% of white enrollment decline. That is not to say multiracial students are "replacing" white students. Many multiracial students have one white parent and, under the old single-race system, might have been counted as white. The growth of the multiracial category partly reflects families who previously had no accurate option now selecting one that fits.
Brookings Institution research on multiracial population growth found that white-Black biracial identification has grown fastest in the South, where such identification was historically discouraged.
What to watch
The trajectory shows no signs of flattening. If multiracial enrollment continues growing at even half its recent pace, 840 students per year rather than 1,680, the category will pass 30,000 students by 2032 and exceed 6% of statewide enrollment. It would likely surpass Asian and Pacific Islander students combined well before that point. It already has: the 24,908 multiracial students in 2026 outnumber the 17,067 Asian, Native American, and Pacific Islander students combined by nearly 8,000.
The practical consequence is in the data itself. A district that was "85% white" in 2009 and is "72% white" in 2026 may not have changed as much as those numbers suggest, if some of the shift reflects families re-identifying rather than departing. Any district using racial composition trends to guide staffing or programming should treat the multiracial category as a signal of increasing complexity, not a simple population count.
For Arkansas, where statewide enrollment has been essentially flat for 16 years, losing just 1,640 students since 2010, the multiracial story is not about growth or decline. It is about a state whose student body is quietly becoming harder to describe in the categories the forms provide.
Detailed code that reproduces the analysis and figures in this article is available exclusively to EdTribune subscribers.
Discussion
Sign in to join the discussion.
Loading comments...