Bentonville↗ET added 370 students in 2025-26. It is one of 22 Arkansas districts at all-time enrollment highs. Ninety-five districts, meanwhile, just recorded their lowest headcounts in at least two decades. For every district celebrating a record, more than four are setting the wrong kind.
The 2025-26 school year brought the steepest single-year enrollment drop in Arkansas in at least 20 years: 8,916 students gone from the public system, a 1.9% decline that erased years of slow gains. Total public enrollment fell to 465,421, the lowest since 2006 and 14,011 below the 2020 peak of 479,432. Three out of four districts lost students. One in five lost 5% or more.
A Widening Ratio
The split between districts at record highs and those at record lows has been growing for years. In 2026, it hit an extreme.
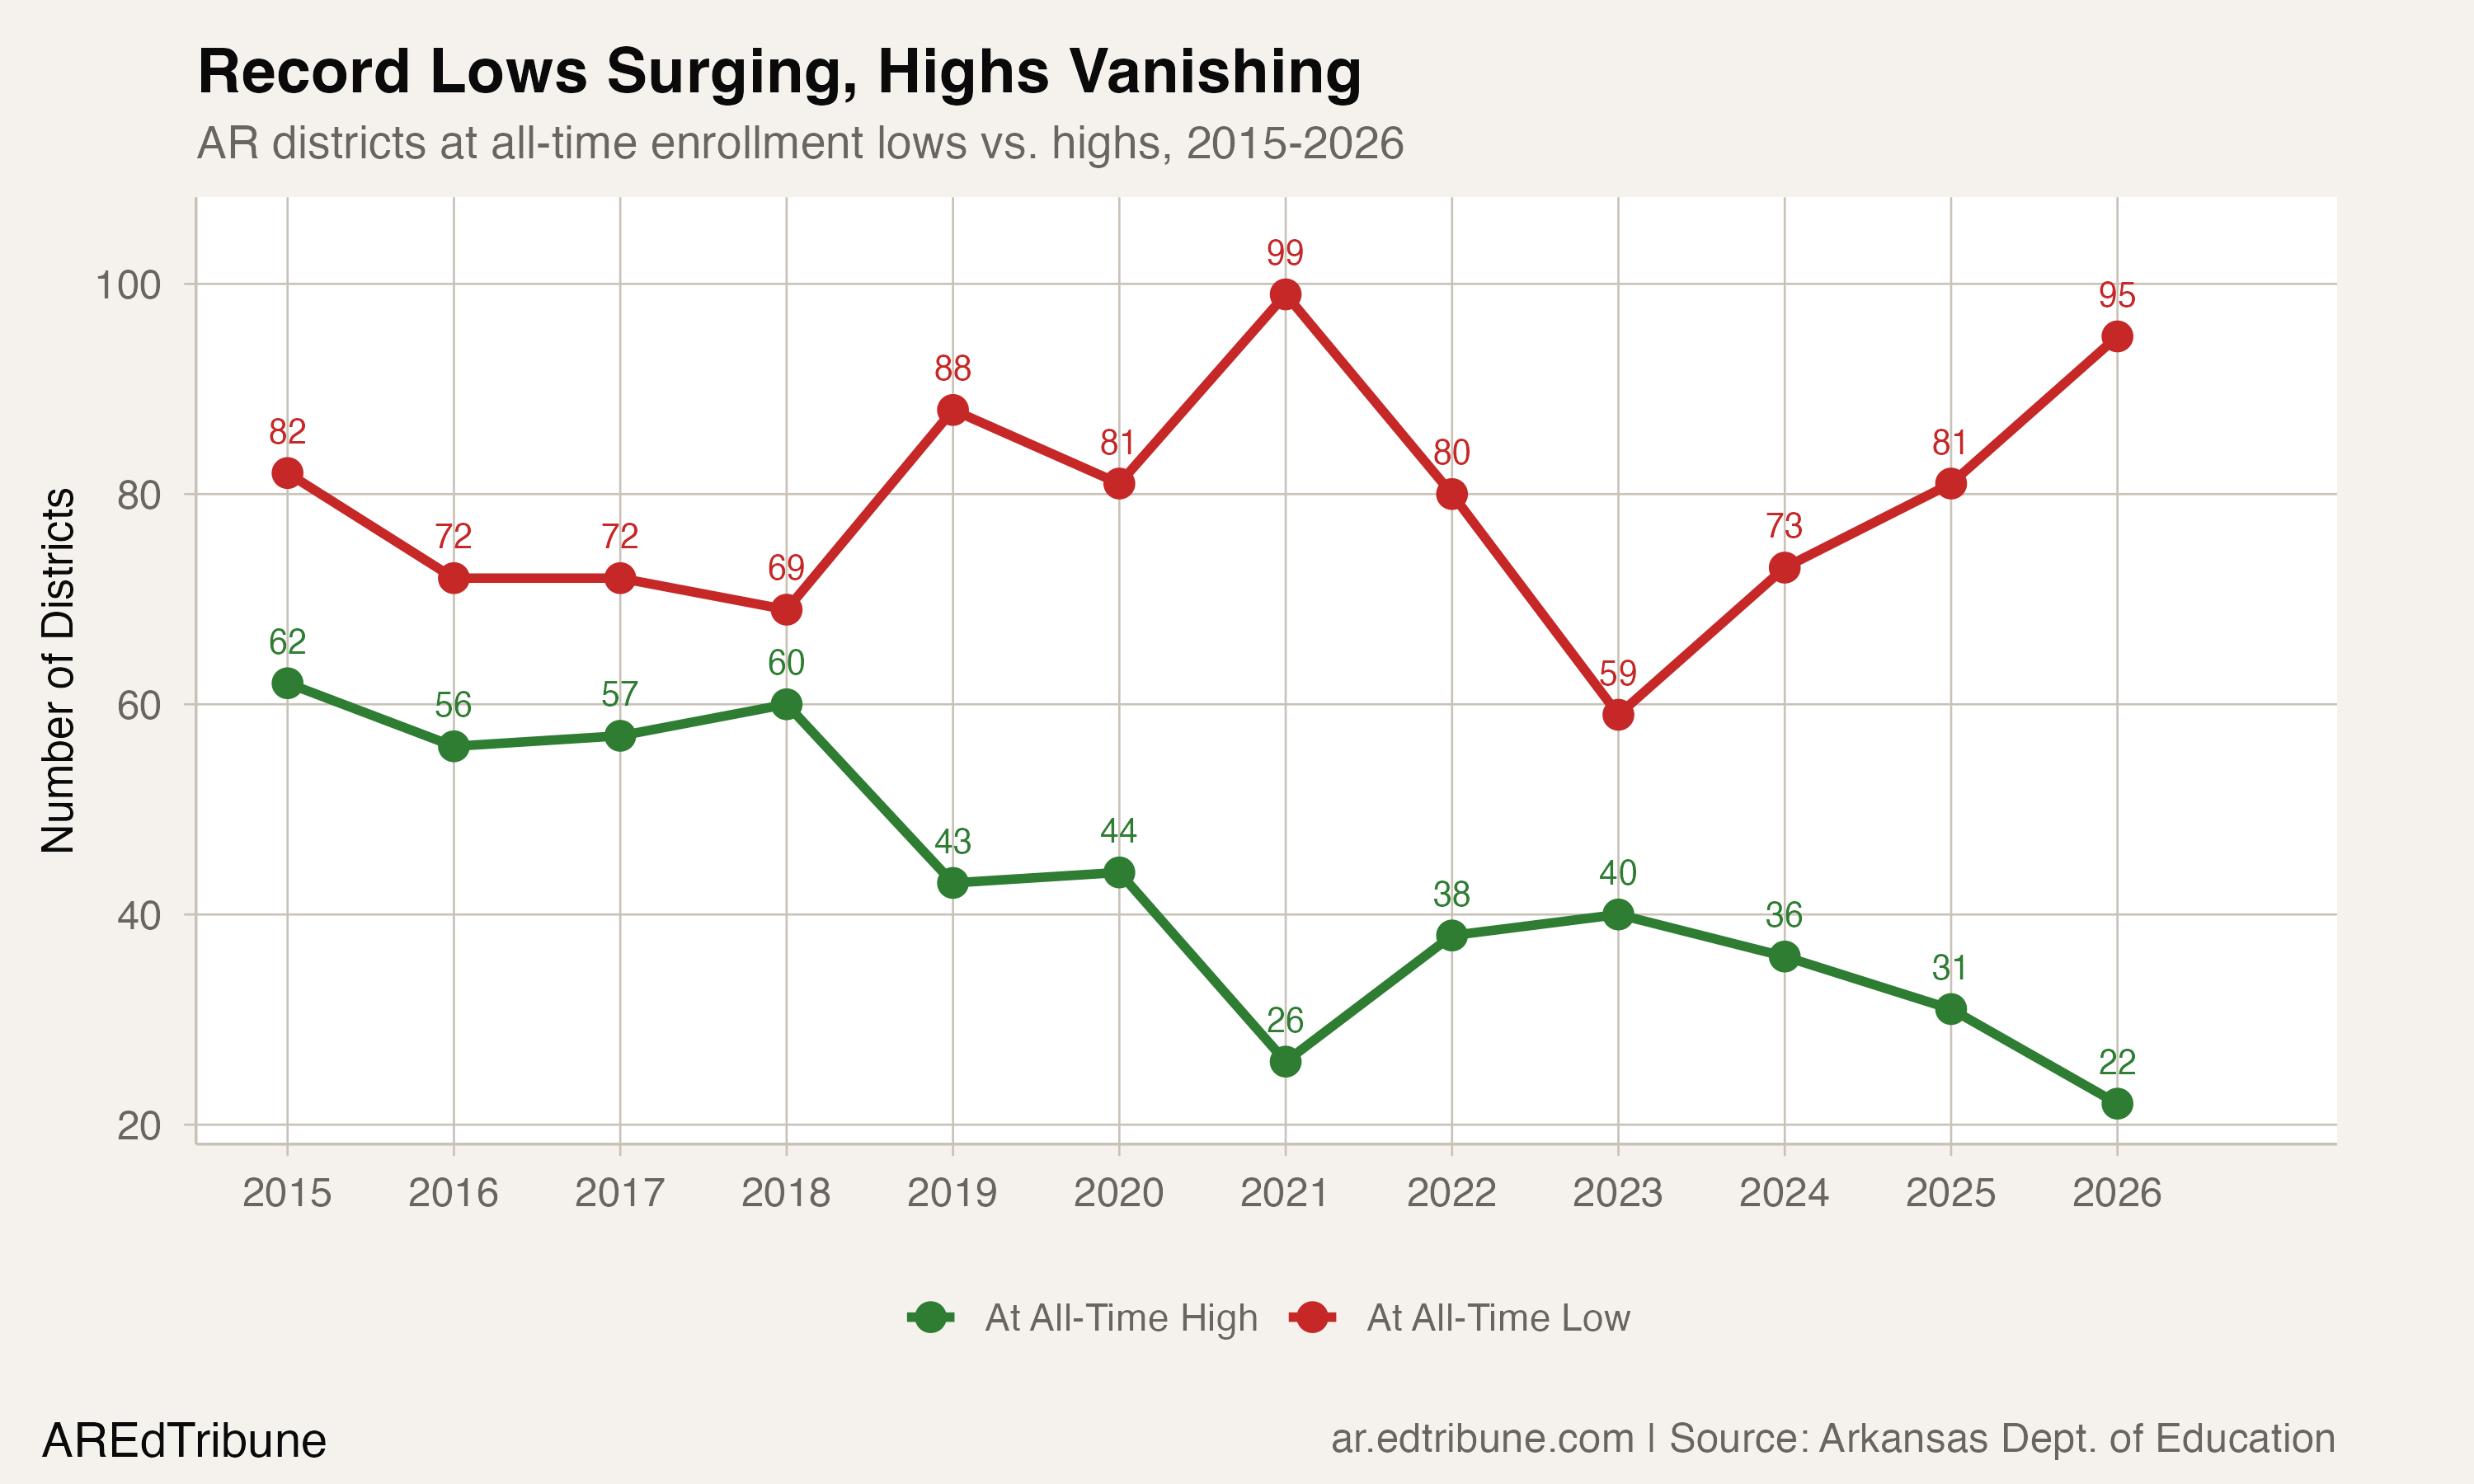
In 2018, the ratio of districts at all-time lows to all-time highs was roughly 1:1. By 2021, it was 3.8:1 as COVID drove enrollment out of larger systems. A partial recovery in 2022-23 brought the ratio back down. Then it climbed again: 2.6:1 in 2025, 4.3:1 in 2026.
The 95 districts at record lows enroll 139,133 students, 29.9% of the state total. The 22 at record highs enroll 54,002. The shrinking side of the ledger educates 2.6 times as many students as the growing side.
Who Is Growing
Nine of the 22 districts at all-time highs are charter or virtual entities: Arkansas Connections Academy (5,780 students), Arkansas Virtual Academy (5,779), LISA Academy (4,320), Academics Plus (2,001), Exalt Academy (1,109), Graduate Arkansas Charter (807), Premier High Schools (748), Academies of Math and Science (606), and School for Advanced Studies-Northwest Arkansas (135). Together, these nine account for 21,285 students, nearly 40% of all enrollment in at-high districts.
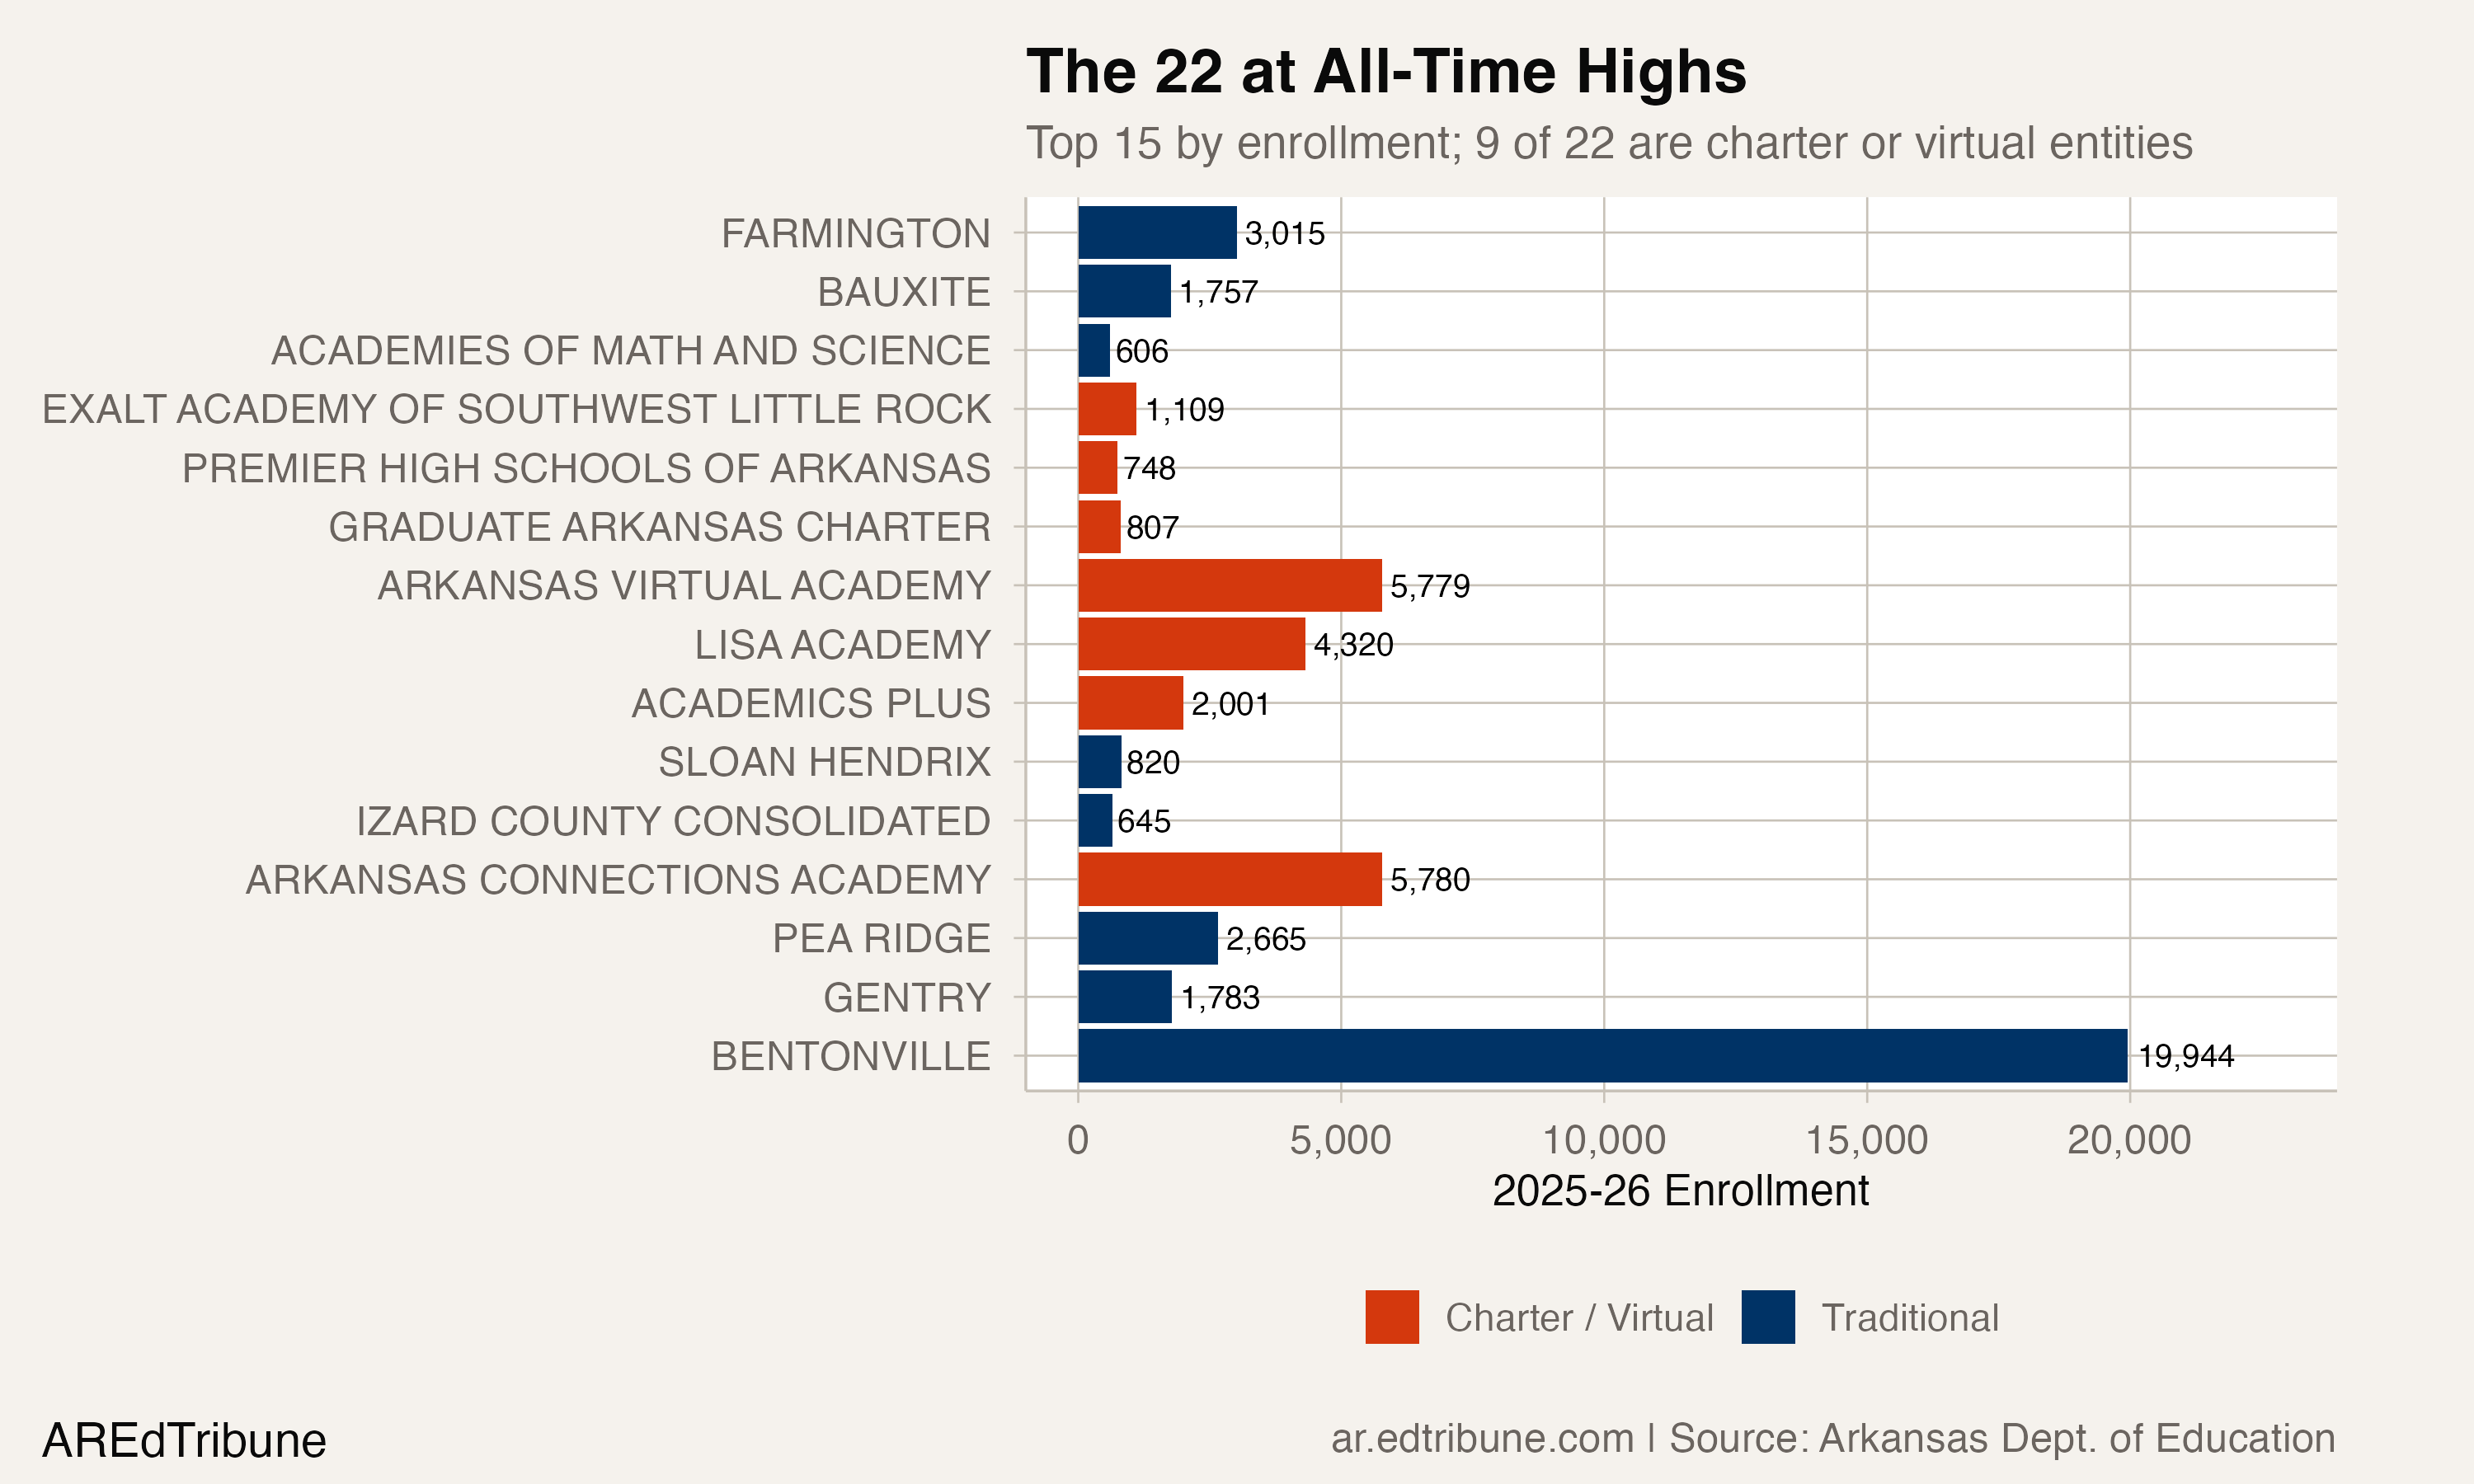
The traditional districts at record highs are dominated by Benton County: Bentonville (19,944), Farmington↗ET (3,015), Pea Ridge↗ET (2,665), and Gentry↗ET (1,783). Northwest Arkansas is the state's growth engine. Census estimates put the Fayetteville-Springdale-Rogers metro at 605,615 people in 2024, up 2.3% in a single year. Bentonville alone has grown 116.5% since 2005, from 9,210 students to 19,944.
The remaining traditional districts at highs are scattered small systems: Bauxite↗ET (1,757), Sloan Hendrix (820), Izard County Consolidated (645), Ouachita↗ET (552), Scranton (451), Armorel (458), and Nevada↗ET (433). Most are under 1,000 students, where a single new housing development or a small employer can swing enrollment.
The Delta and the Decline Streaks
The deepest losses concentrate in the Arkansas Delta and south-central corridors. Seven districts have declined every single year since 2015, an 11-year unbroken streak: Blytheville↗ET, Watson Chapel↗ET, Dumas, Osceola↗ET, Camden Fairview, Lakeside (Chicot County), and Riverview.
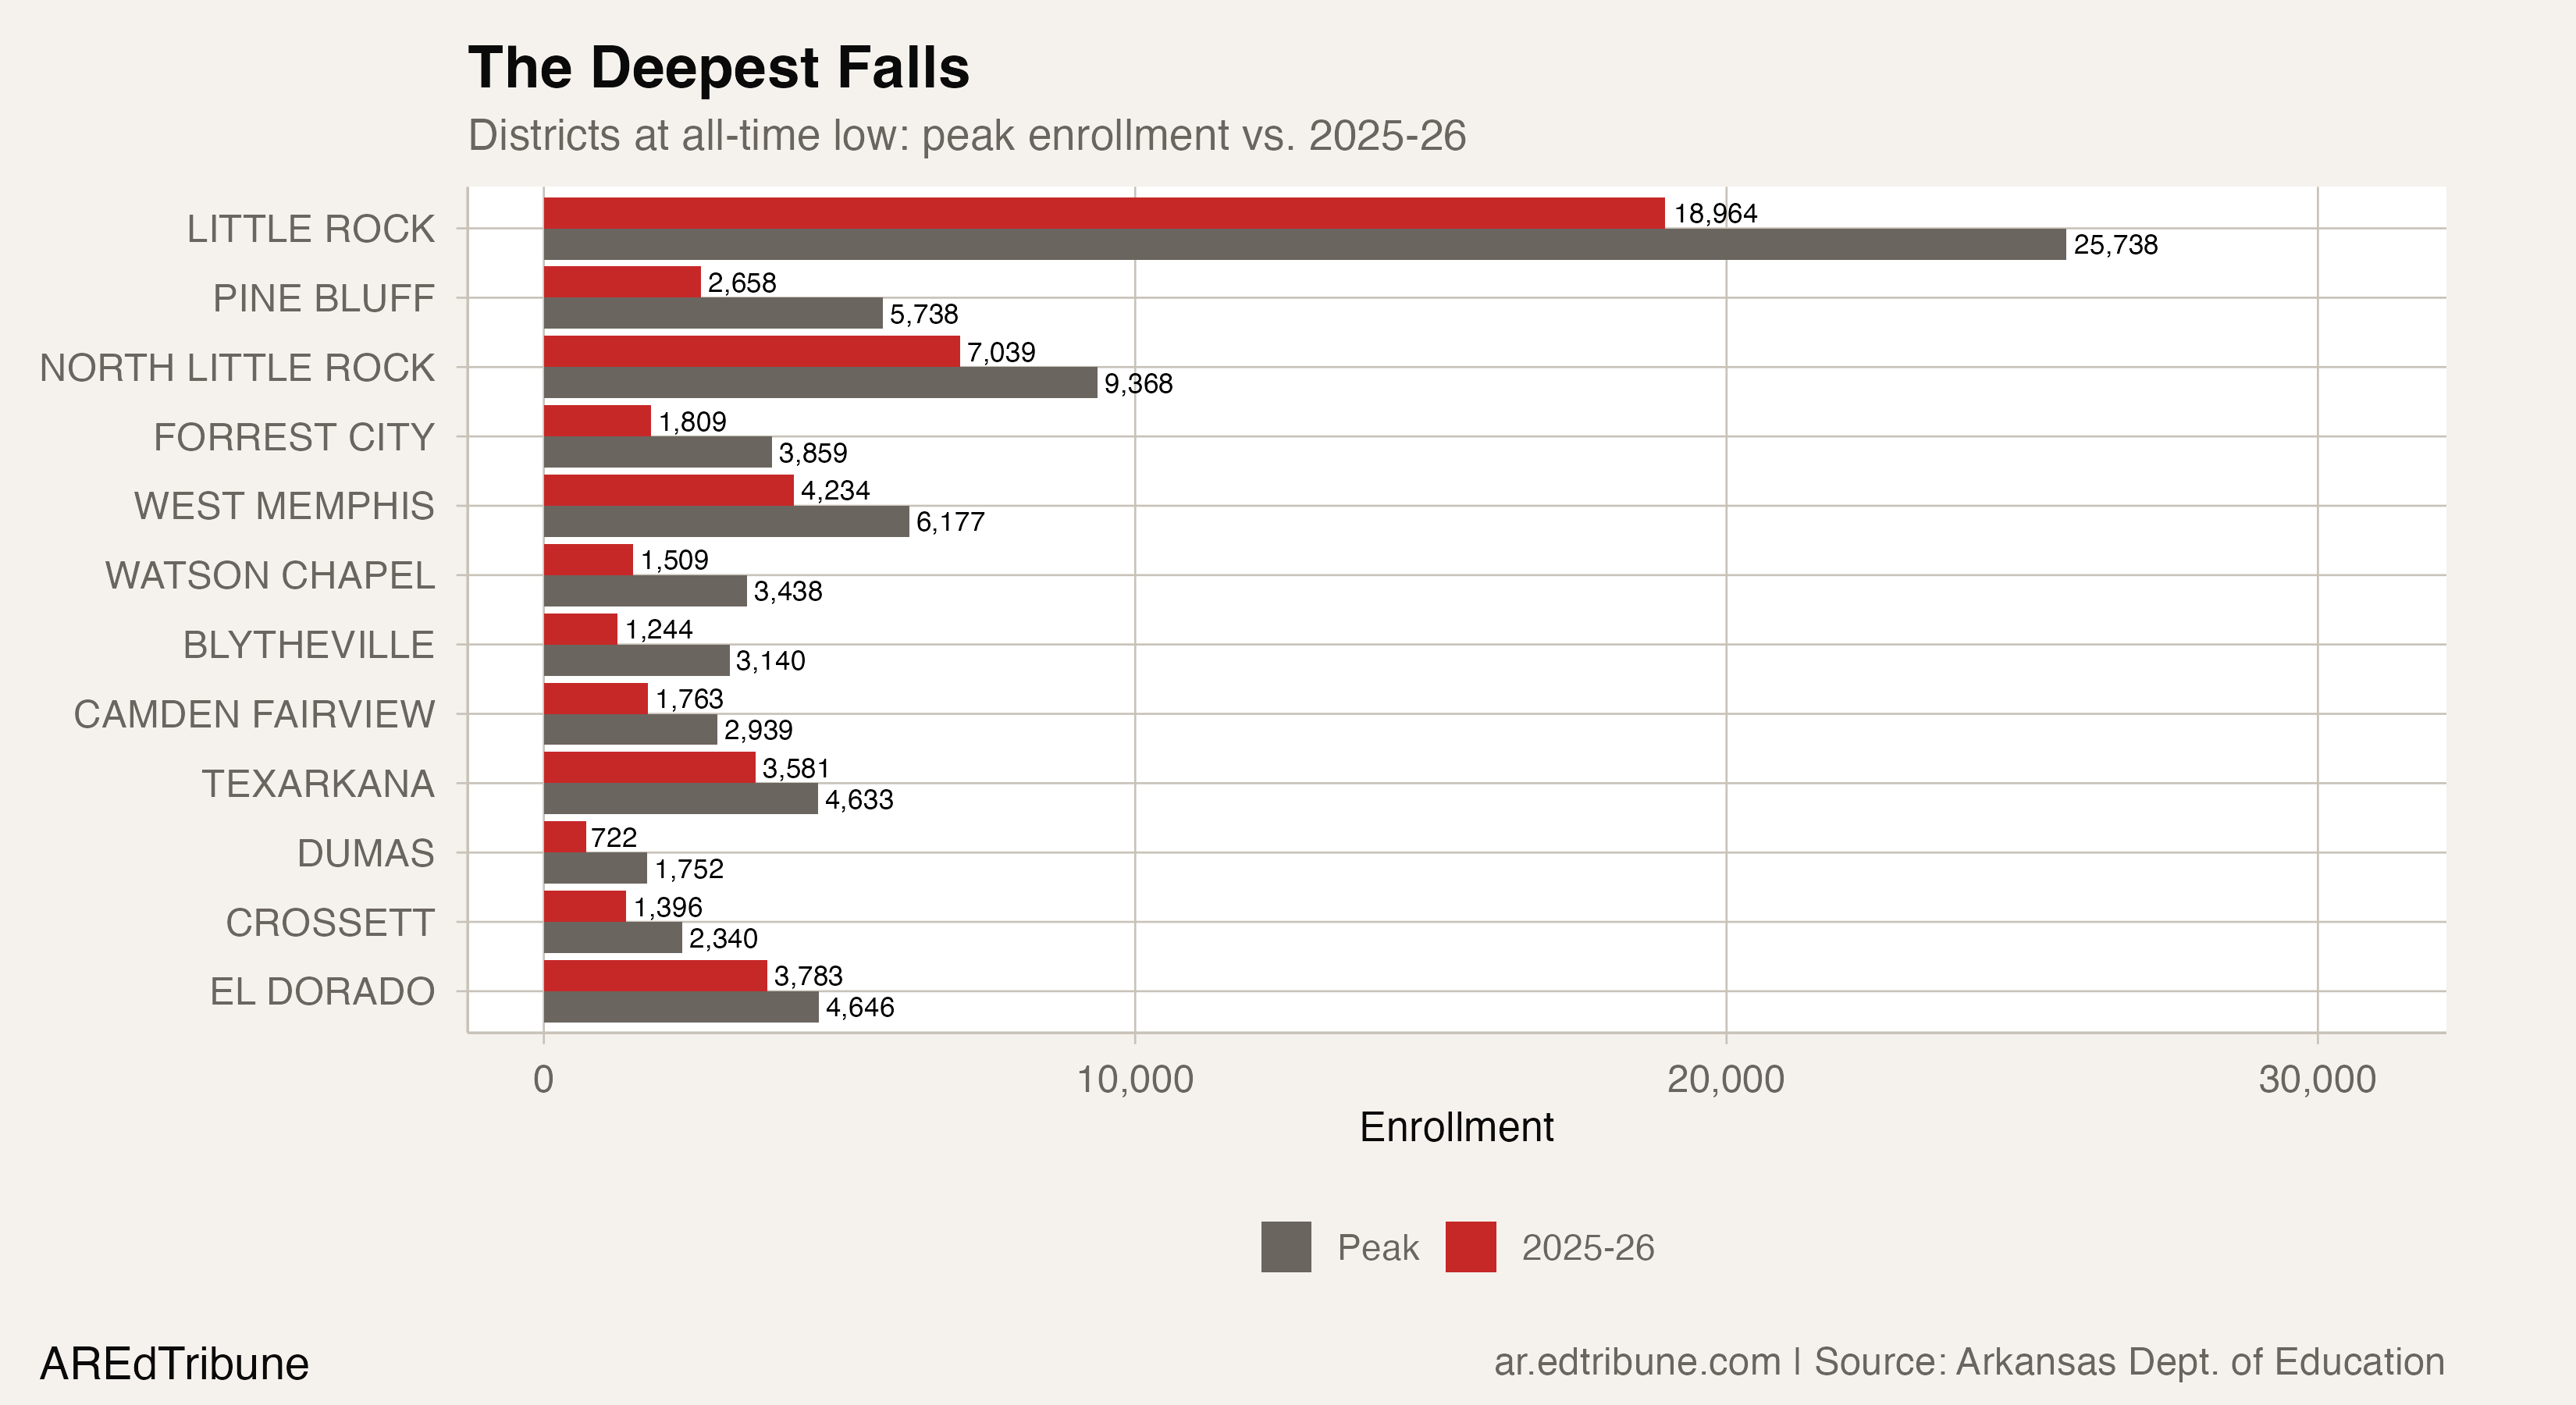
Little Rock↗ET has lost 6,774 students from its 2008 peak of 25,738, a 26.3% decline to 18,964. Pine Bluff↗ET has lost 53.7% of its enrollment since 2005, falling from 5,738 to 2,658. Blytheville is down 60.4%, from 3,140 to 1,244. Watson Chapel, just south of Pine Bluff, has lost 56.1%, from 3,438 to 1,509. Forrest City↗ET has lost 53.1%, from 3,859 to 1,809.
These are not suburbs losing marginal students to charter schools. These are communities losing population. Pine Bluff has declined more than 30% since 2000 and ranks among the fastest-shrinking cities in America. Blytheville fell from nearly 25,000 people at its 1970 peak to roughly 13,000 by the 2020 census, a collapse that began when Eaker Air Force Base closed in 1992 and drove 7,500 people out of the area.
Small Districts, Big Vulnerability
More than half of the 95 districts at record lows enroll fewer than 1,000 students. Of the 144 districts statewide that fall below that threshold, a significant share are now at their floor.
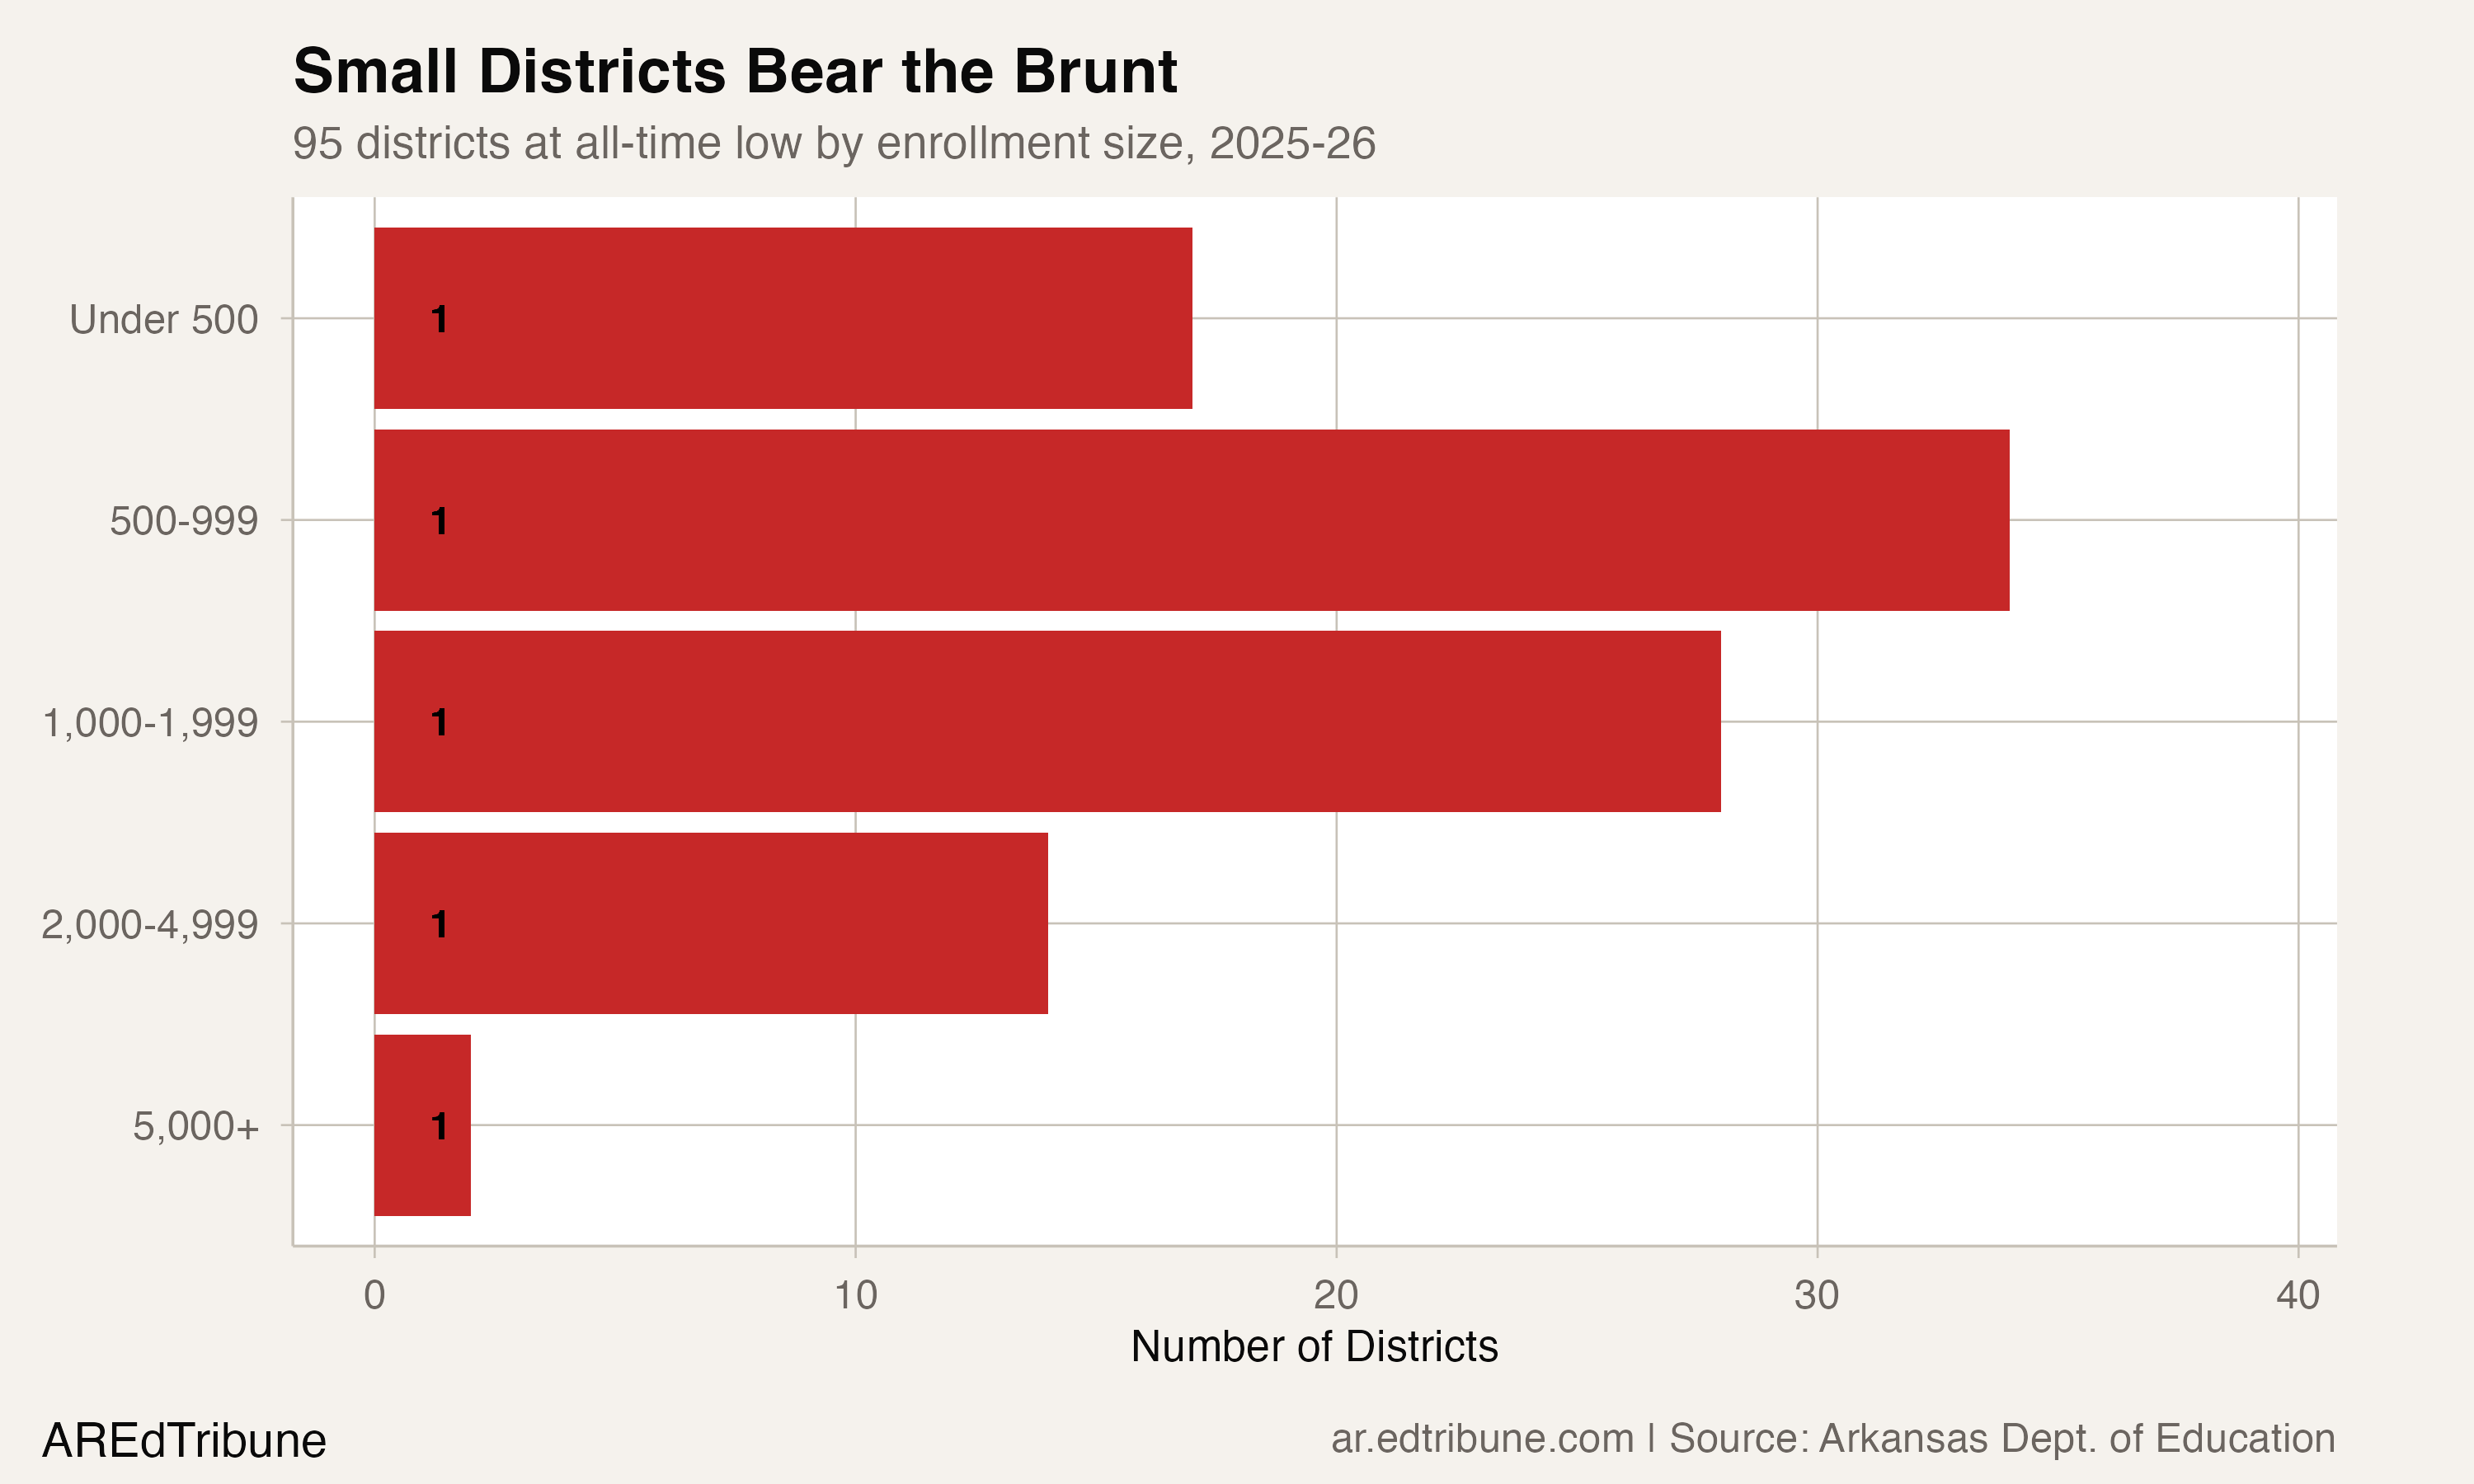
Thirty-four at-low districts fall between 500 and 999 students, the range where each lost student carries outsized fiscal weight. At Arkansas's foundation funding level of $8,162 per pupil for 2025-26, a district of 600 that loses 30 students forfeits roughly $245,000, enough to fund two teaching positions.
"When districts lose students, financial solutions like staff cuts are complicated because lost students don't all go to the same school, aren't all in the same grade." — KUAF, March 2026
At the extreme end of percentage loss, Brinkley↗ET has shed 61.3% of its enrollment since 2005, falling from 950 to 368 students. Lafayette County is down 60.1%, from 993 to 396. Augusta has lost 58.5%, from 686 to 285. These districts are approaching the scale at which maintaining a full complement of grade-level instruction becomes structurally difficult.
Two Growth Engines, Two Diverging Trajectories
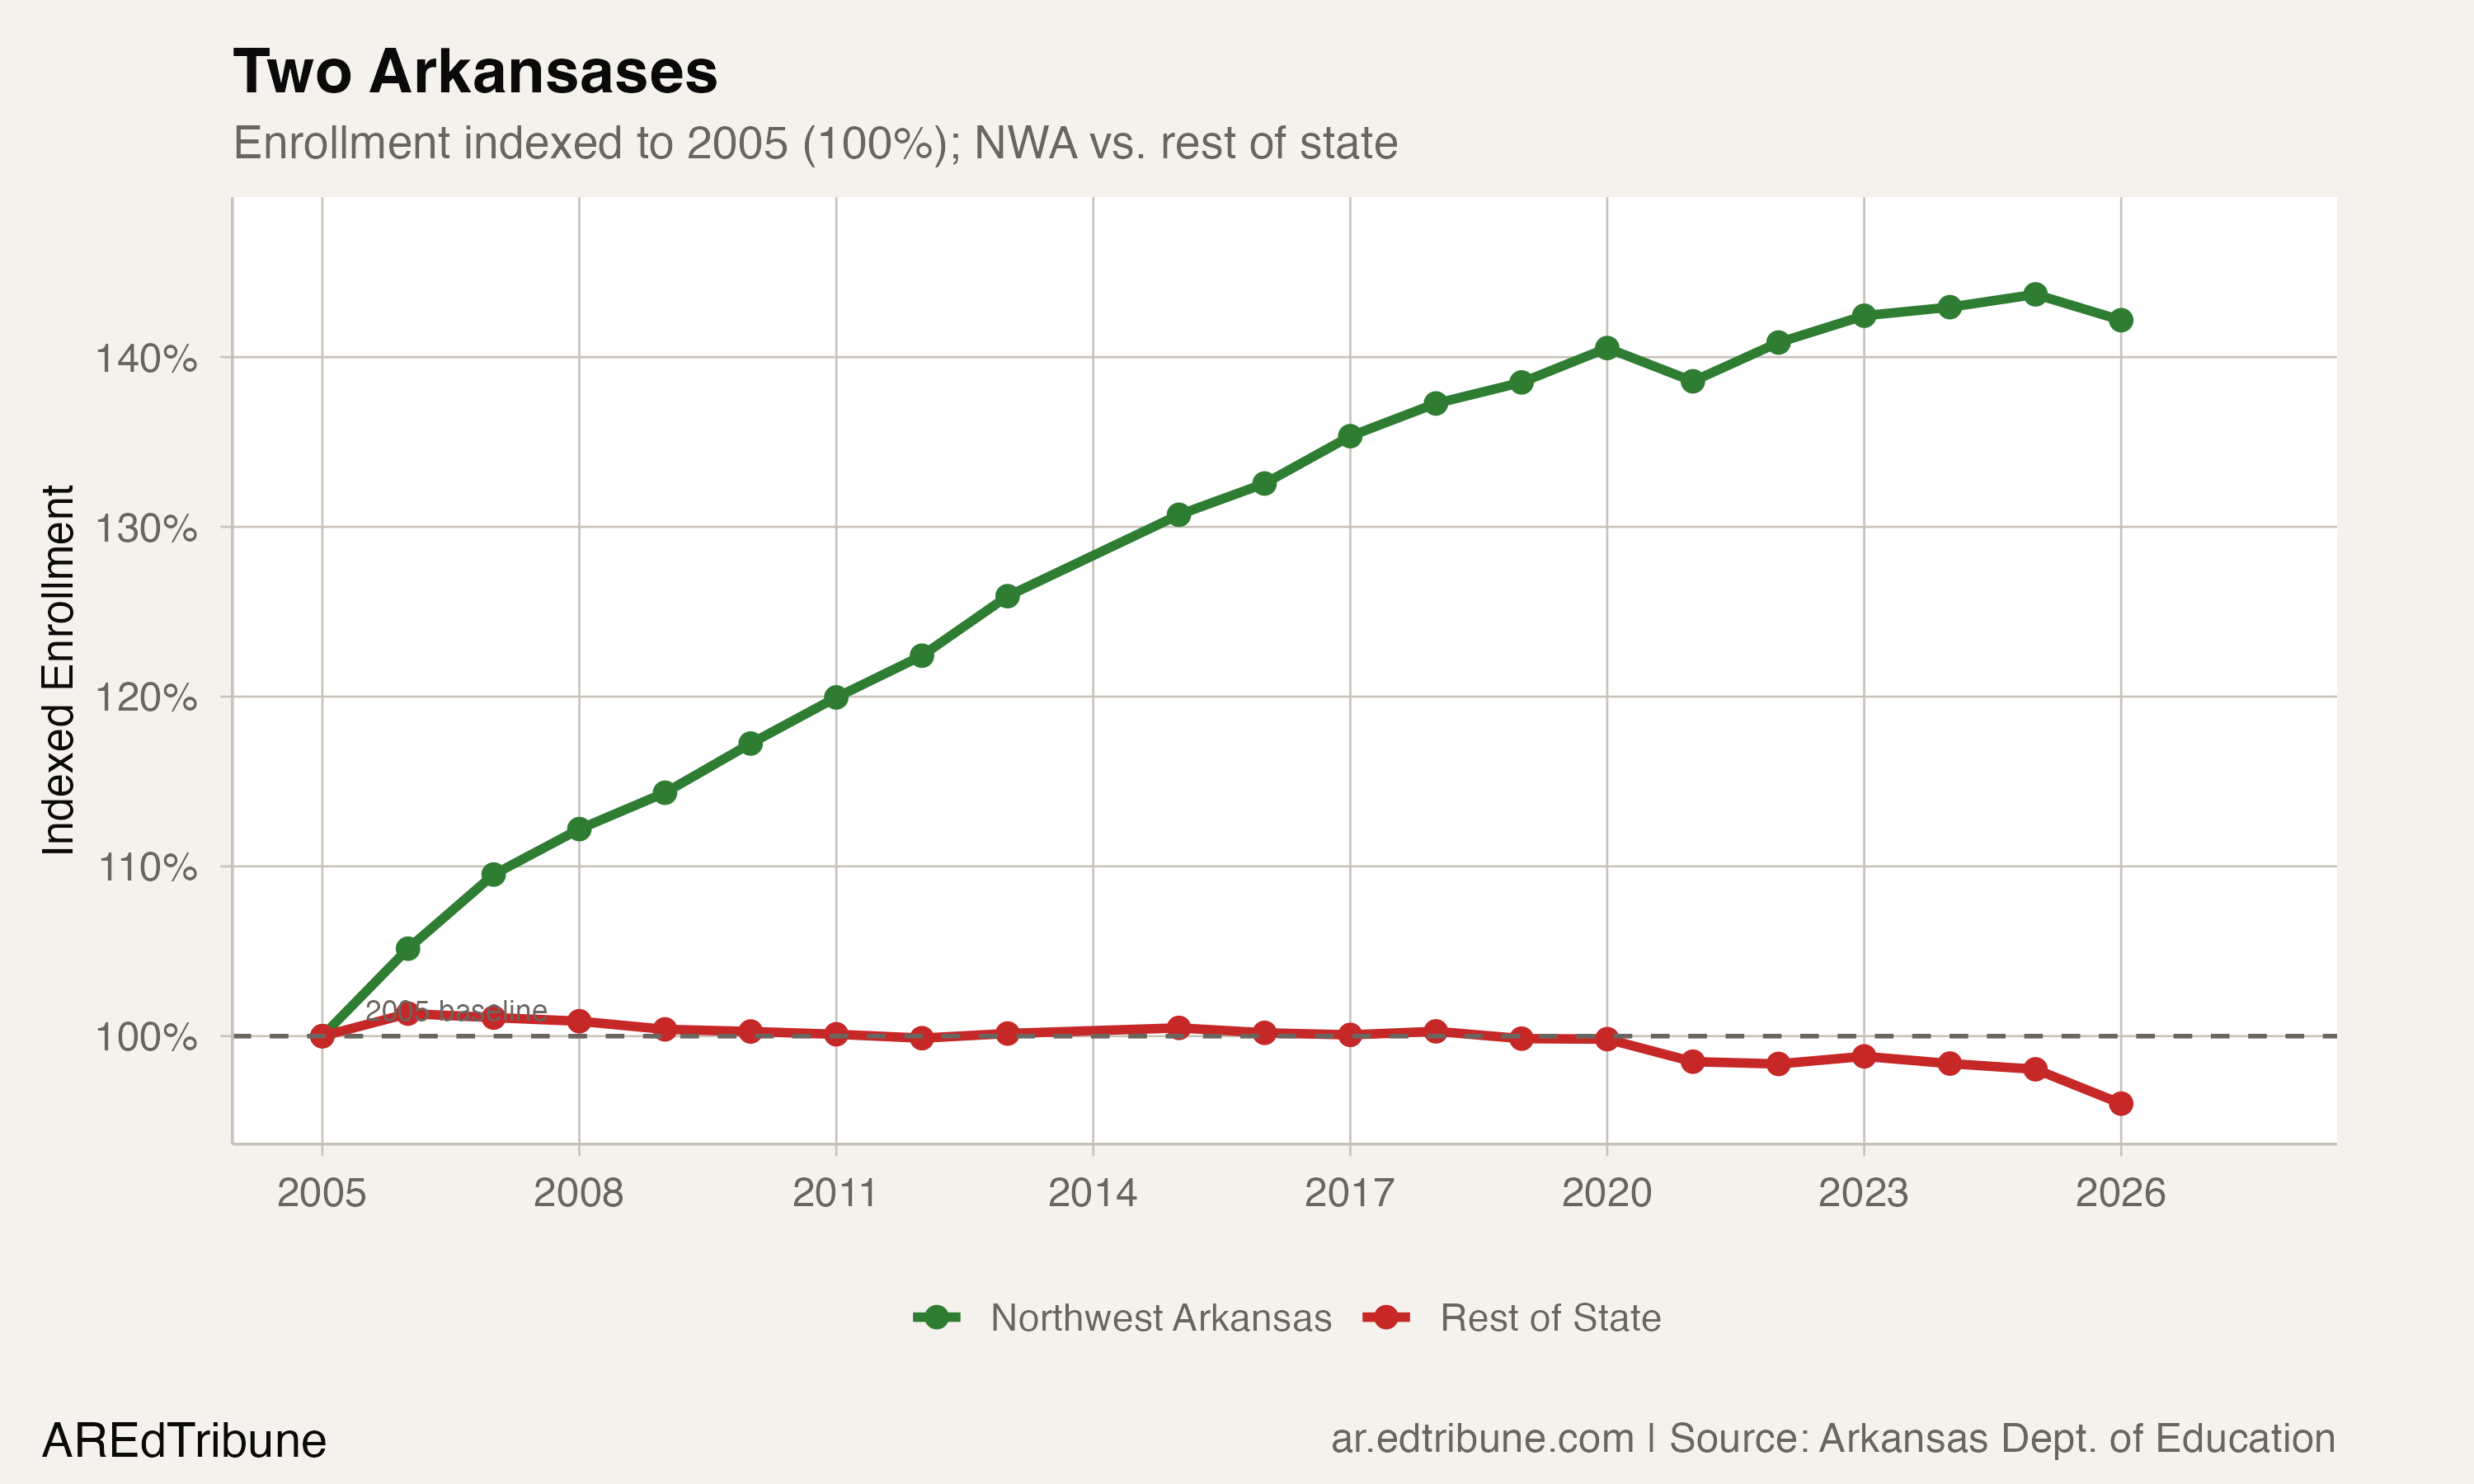
Northwest Arkansas, defined here as 15 districts in the Fayetteville-Springdale-Rogers corridor, has grown 42.2% since 2005, from 60,712 to 86,317 students. The other 244 districts have collectively lost 15,699 students over the same period, a 4.0% decline. NWA's share of state enrollment has risen from 13.3% to 18.5%.
The two trend lines ran roughly parallel through the early 2010s. Then NWA kept climbing while the rest of the state flattened. Since 2020, the divergence has accelerated: the rest-of-state line fell below its 2005 baseline for the first time.
The separation is not only geographic. The charter and virtual sector, which includes nine of the 22 at-high districts, draws students statewide. Arkansas Connections Academy and Arkansas Virtual Academy together enroll 11,559 students with no geographic footprint. Their growth can hollow out brick-and-mortar districts anywhere.
The EFA Acceleration
The timing of the 2025-26 acceleration aligns with the third year of Arkansas's Education Freedom Account program, created by the LEARNS Act of 2023. In Year 1, the program capped participation at 1.5% of enrollment. In Year 2, 14,256 students received vouchers. In 2025-26, with universal eligibility, more than 46,000 applications were approved, at an estimated state cost exceeding $327 million, $50 million more than budgeted.
The program's direct impact on public enrollment is debated. KATV reported that of the 46,000 recipients, roughly 28,000 were already in private schools and 16,000 already homeschooling, with about 2,000 transferring from public to private. If accurate, the direct public-to-private transfer accounts for a fraction of the 8,916 net decline.
But the indirect effects may be larger. The voucher subsidizes families who might otherwise have enrolled in public school for the first time. And the fiscal drain is real regardless of where the students came from: the state is spending $327 million on students who are not in public classrooms, money no longer available for the foundation funding formula.
"95 percent of them already were attending private schools, so this was just an additional expense for the Arkansas taxpayer." — April Reisma, Arkansas Education Association president, KATV
Falling birth rates, post-pandemic homeschool persistence, and continued rural population loss all contribute. Disentangling the voucher effect from these structural forces will require several more years of data.
What Comes Next
The 4.3:1 ratio of lows to highs is a snapshot of a state pulling apart. NWA's growth is fed by corporate migration tied to Walmart and Tyson, forces that show no sign of reversing. The Delta's depopulation is generational and self-reinforcing: fewer students means fewer families means fewer employers means fewer students.
If the EFA program stabilizes at its current participation level, the marginal public-to-private transfer may slow. But if even a small share of the 44,000 existing recipients are families who would otherwise have entered public school, the denominator keeps shrinking. For a district like Brinkley, at 368 students and falling, the margin between operating and consolidation is not measured in percentages. It is measured in families.
Detailed code that reproduces the analysis and figures in this article is available exclusively to EdTribune subscribers.
Discussion
Sign in to join the discussion.
Loading comments...