Seventy of Arkansas's 234 school districts reported exactly 95.0 percent graduation rates in 2024. Not 94.9 percent. Not 95.1 percent. Precisely 95.0.
That is not a coincidence. It is a data suppression threshold. When a graduating cohort is small enough that individual students could be identified from the numbers, the Arkansas Department of Education caps the reported rate at 95 percent. The actual rate for those 70 districts could be anything from 95.1 to 100 percent. The data does not say.
Nearly 30 percent of the state's districts have their true graduation performance hidden behind a regulatory wall.
The Spike in the Data
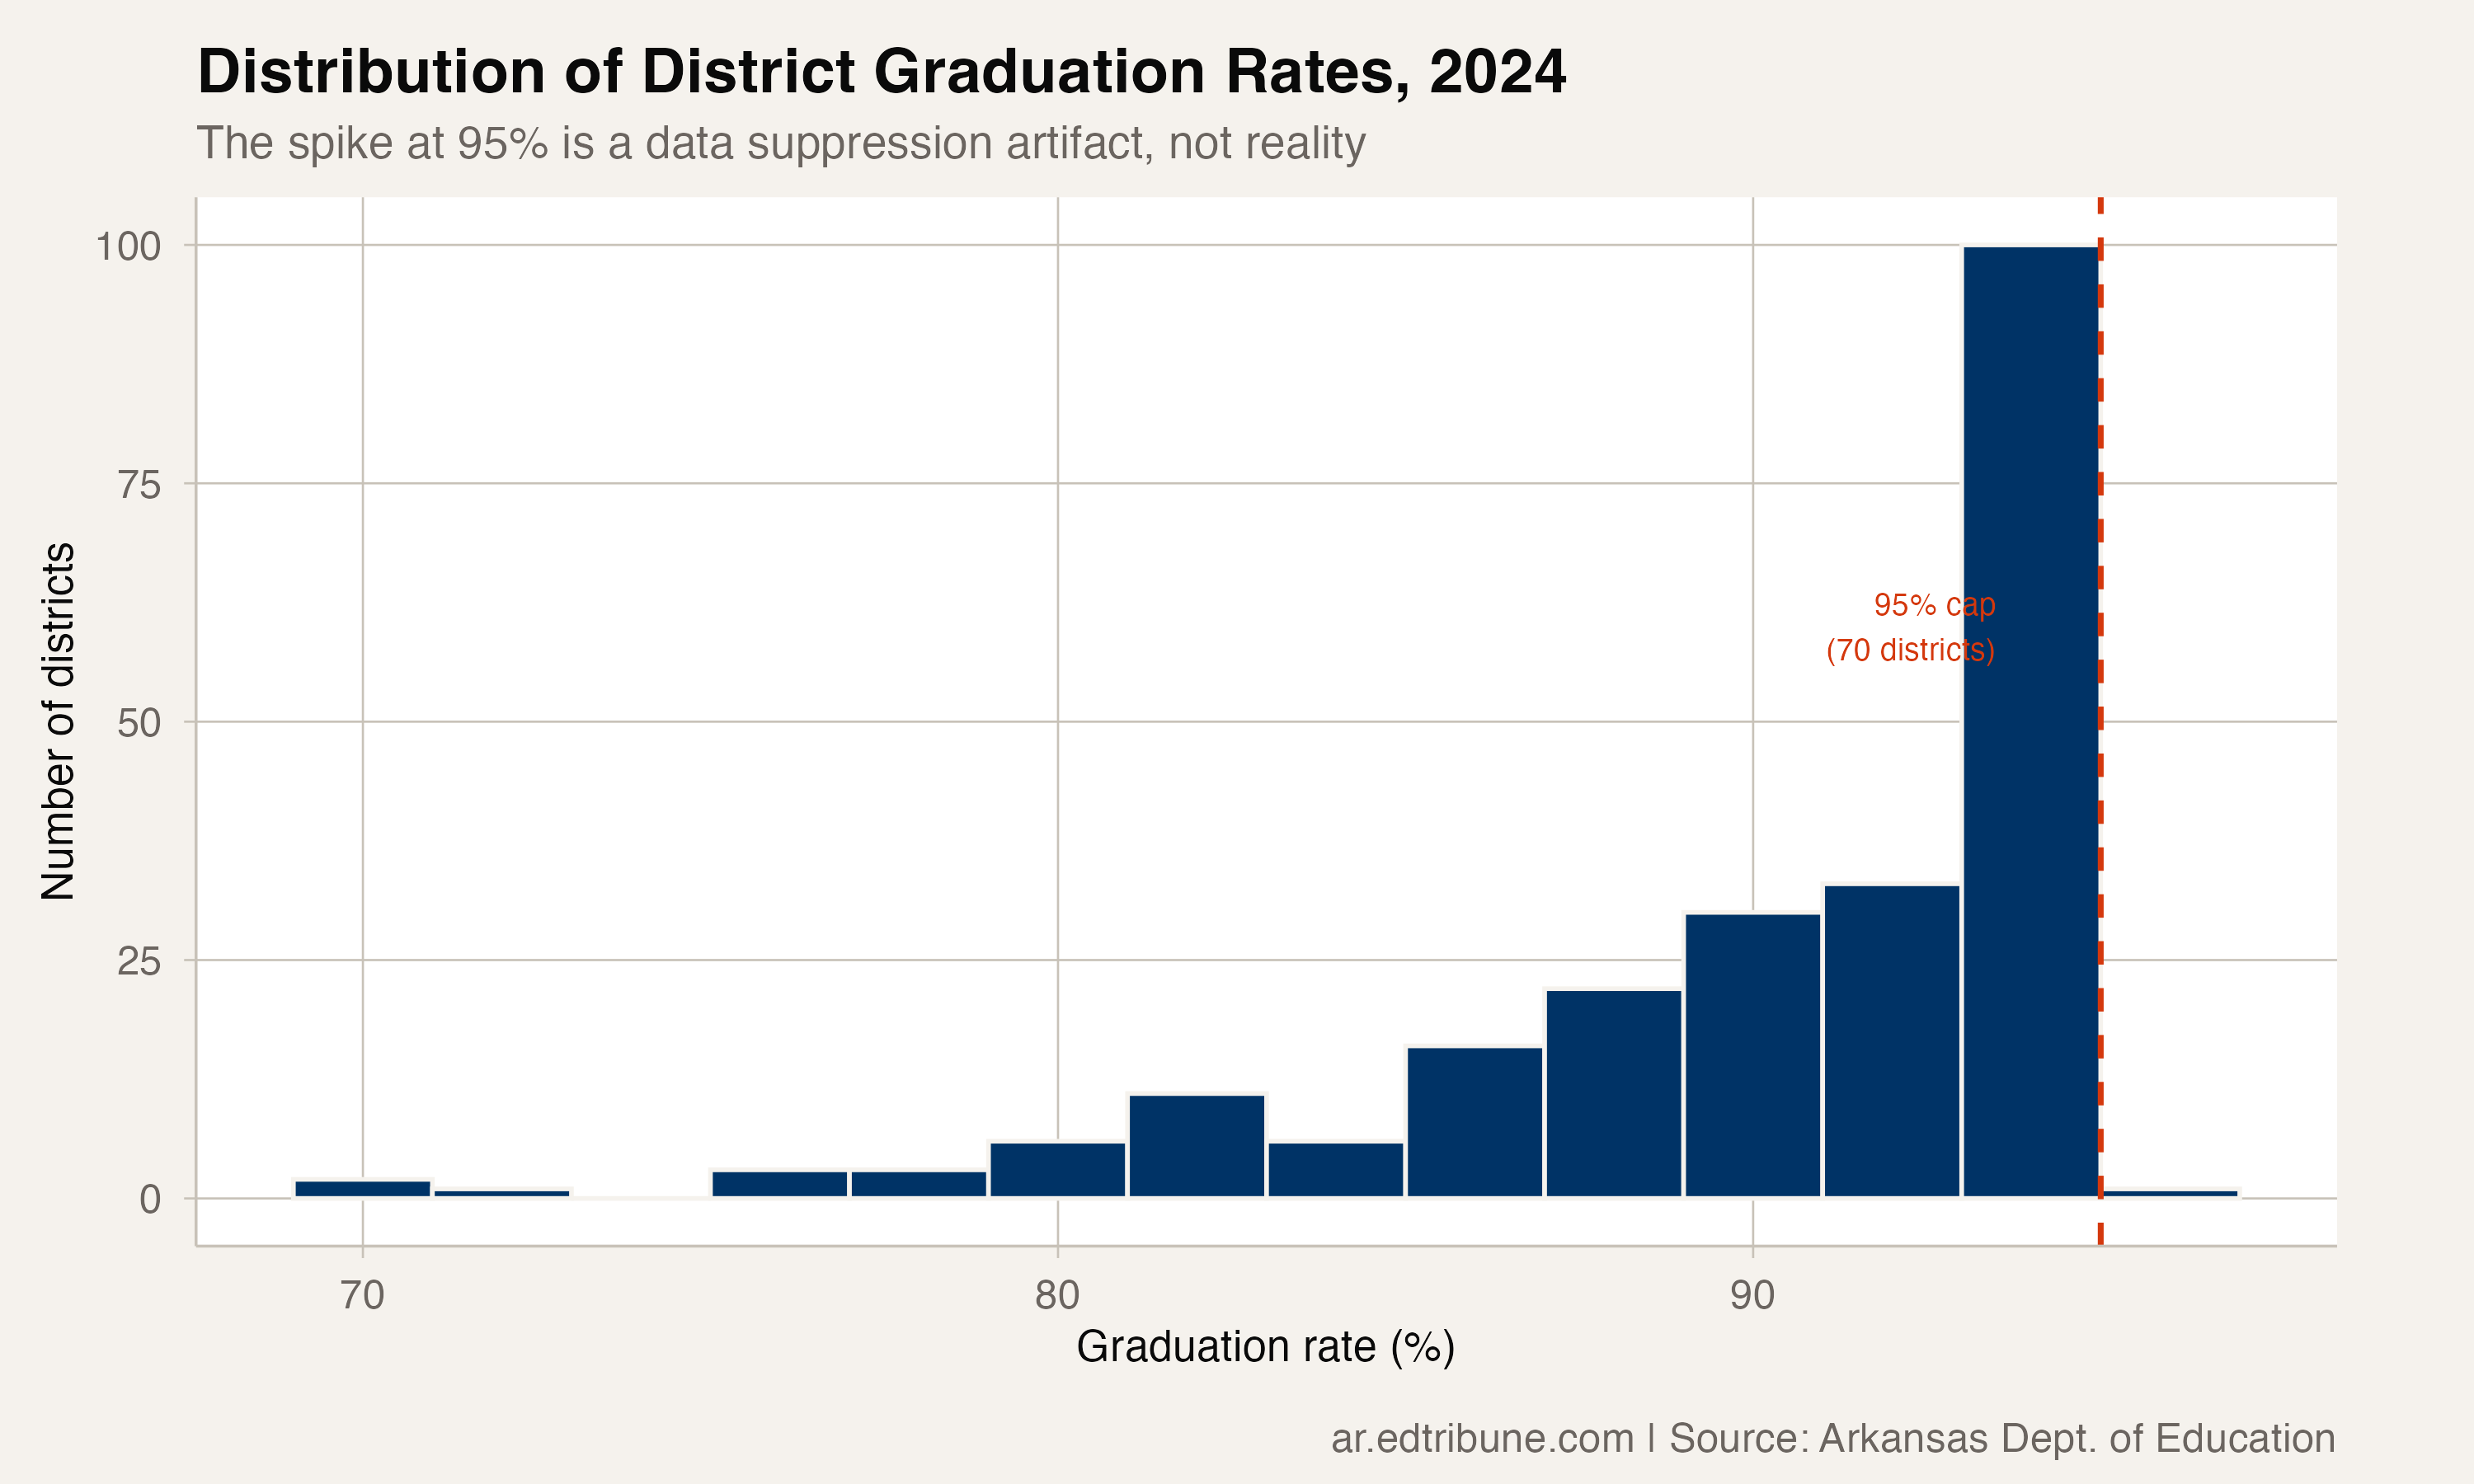
The histogram tells the story. District graduation rates spread across the spectrum from the 60s to the 90s, and then a massive spike at exactly 95 percent. That spike is not a cluster of districts performing at similar levels. It is an artifact of data suppression rules stacking dozens of different true rates into a single reported number.
The districts at 95 percent are overwhelmingly small and rural. Their graduating classes are often in the single digits or low double digits. When a class of 12 students has one non-graduate, reporting "91.7 percent" would effectively identify that student. So the state rounds to 95 percent and moves on.
The Trend Is Getting Worse
The number of districts capped at 95 percent has grown over time.
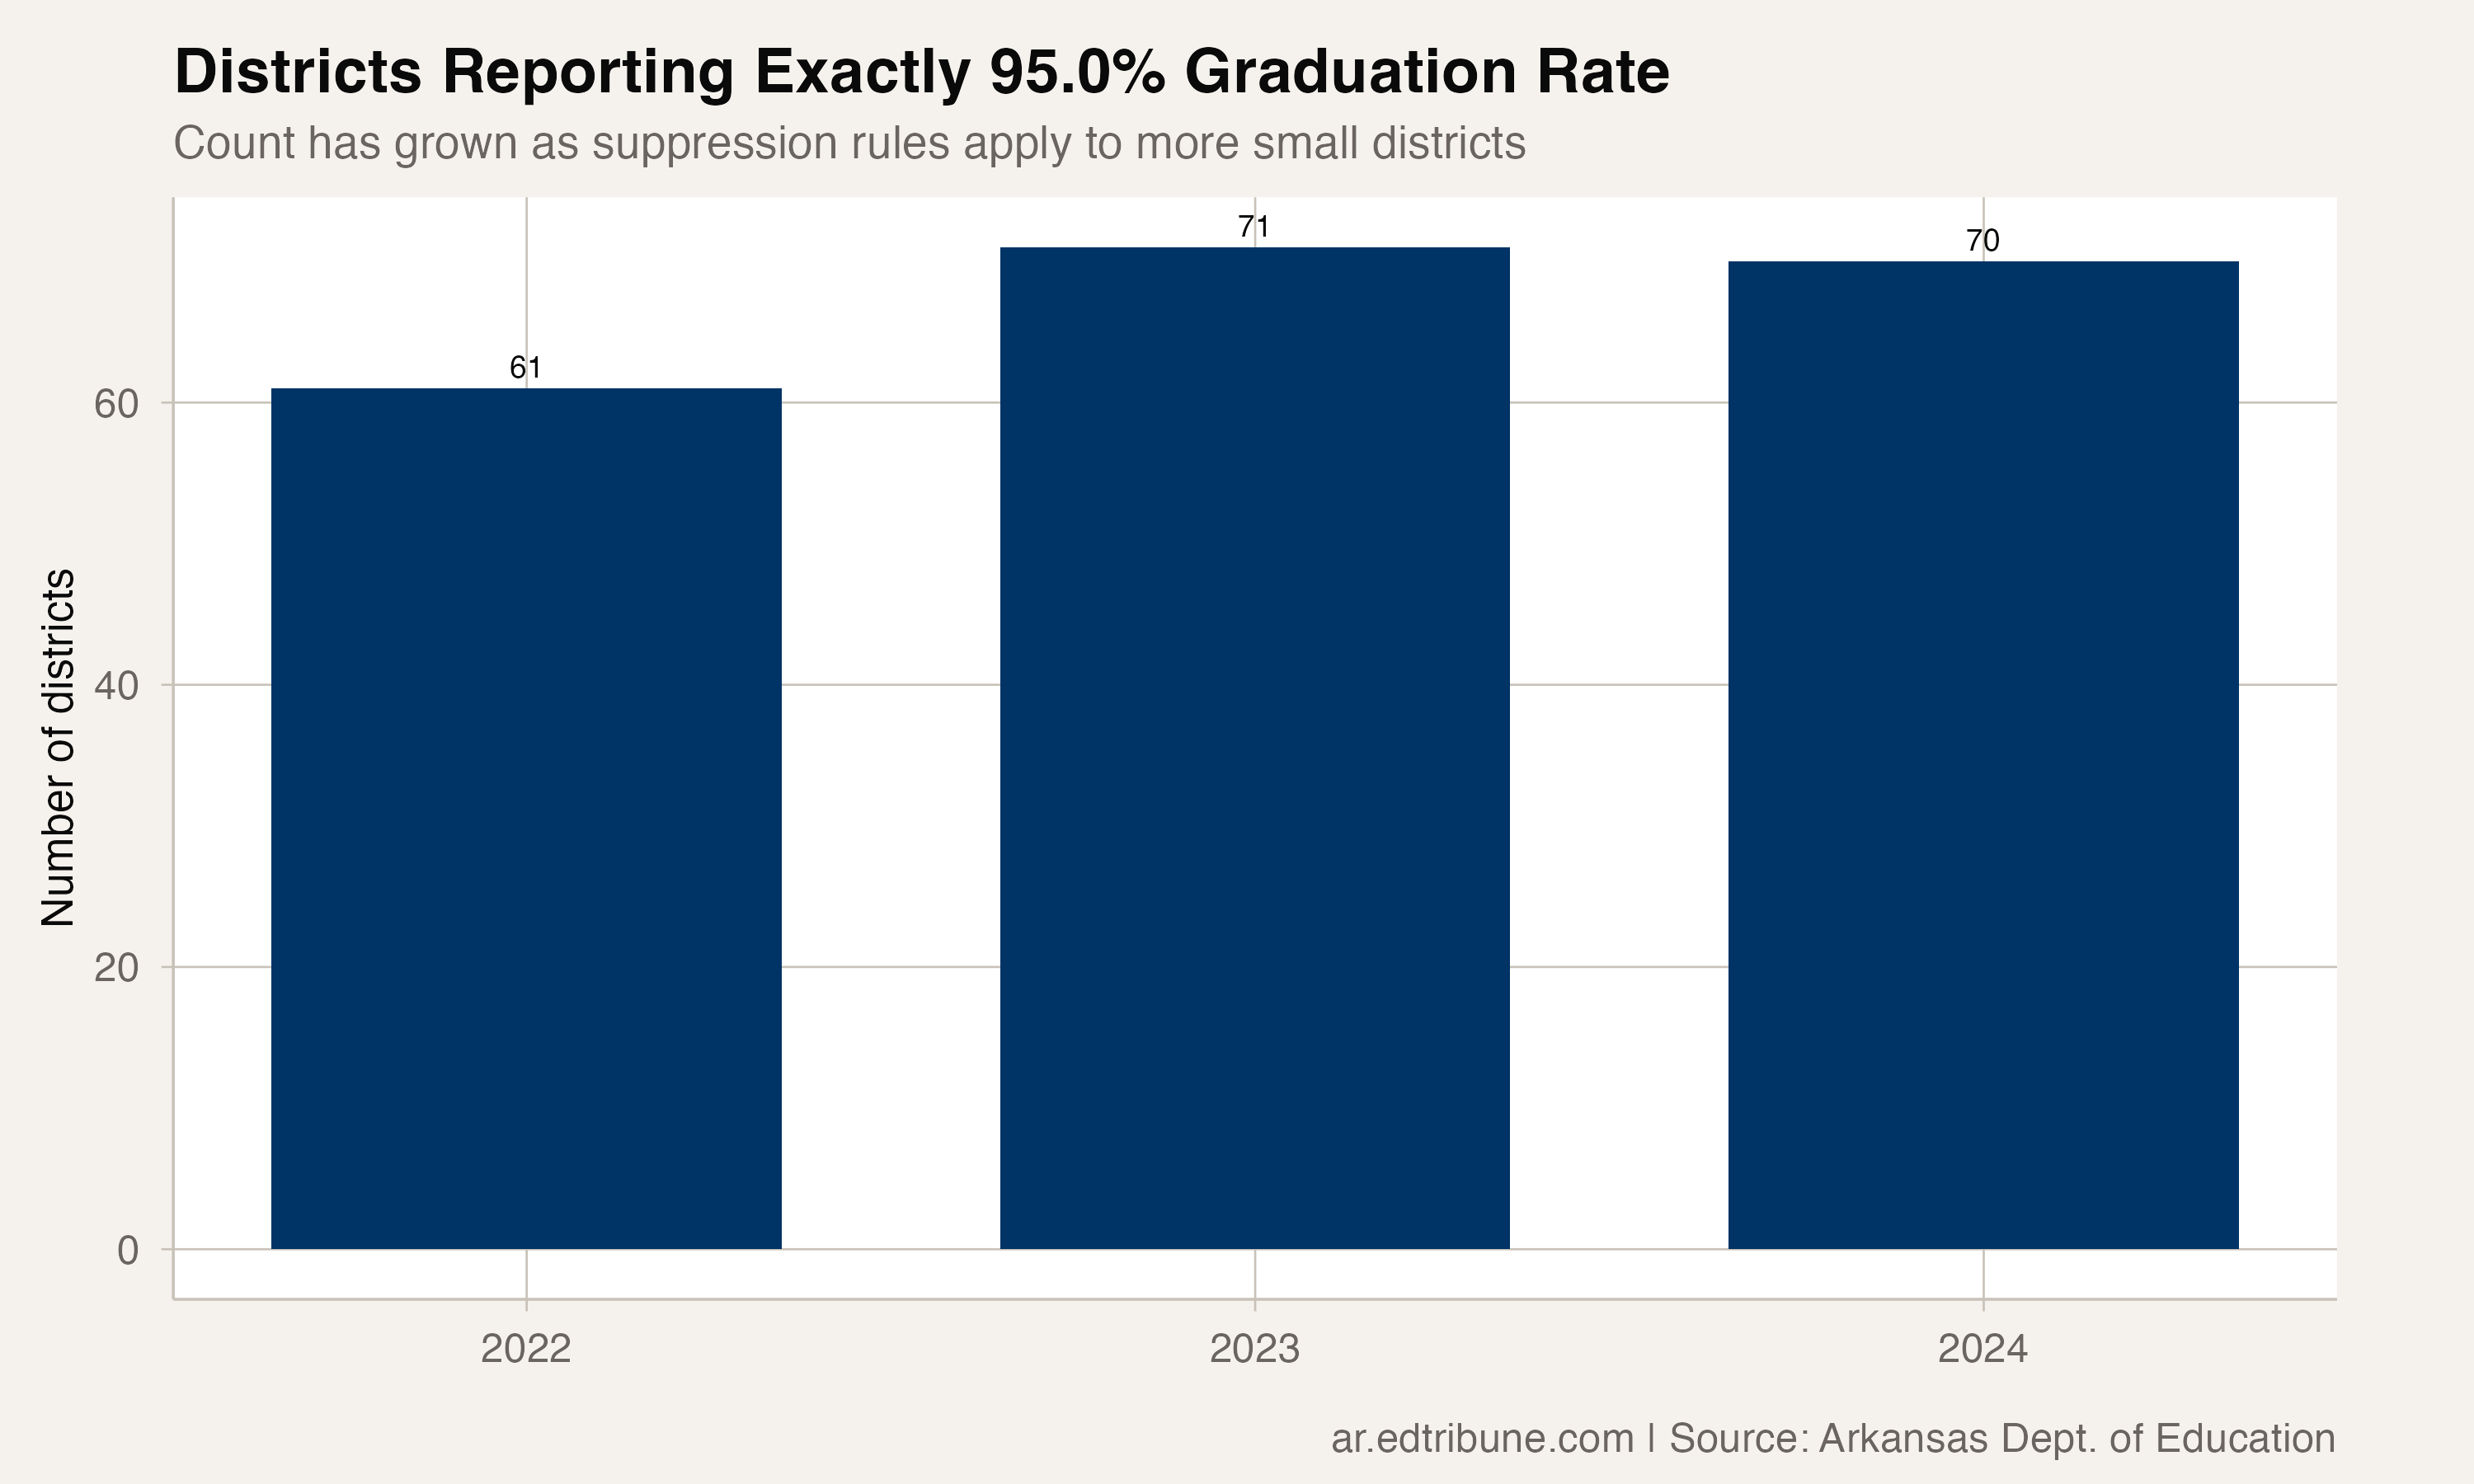
In years with available data, the count fluctuates but the trend is clear: more districts are falling into the suppression zone as rural populations decline and graduating classes shrink. In 2024, 70 districts hit the cap (nearly one in three).
Some districts have reported exactly 95.0 percent in every single year they appear in the dataset. For those districts, there is no trend to analyze, no improvement or decline to measure. Every year is reported identically, regardless of what actually happened.
What This Breaks
The suppression has cascading effects on how we understand graduation in Arkansas.
All-time highs and lows become meaningless. A district capped at 95 percent every year is simultaneously at its all-time high and all-time low. Every year qualifies as both. Statewide counts of "districts at all-time high" or "districts at all-time low" include dozens of these capped districts, inflating both numbers.
Rural performance is invisible. Arkansas has 234 districts, and the majority are small and rural. The 70 capped districts represent the state's rural backbone, communities where a single graduating class might be 8 or 15 students. Their actual performance is entirely hidden. Are small rural districts graduating every student? Or are they losing 1 in 10 and having that loss erased by the cap? The data cannot answer.
Comparisons are distorted. When a district like Mount Ida↗ET reports 69.2 percent, that number is real. Its cohort is large enough to be reported accurately. But its neighbor district, also small and rural, might report 95 percent because its cohort is slightly smaller. The gap between those two districts looks like 26 points. It could actually be 5 points or 30 points. Nobody outside the ADE data office knows.
By the numbers: 70 of 234 districts (29.9%) report exactly 95.0% in 2024. The suppression threshold hides the true performance of nearly a third of Arkansas school districts.
The Districts This Hides
Among the districts perpetually capped at 95 percent are names like Alma↗ET, Corning↗ET, Danville↗ET, Elkins↗ET, Farmington↗ET, and Greenbrier↗ET. Some of these are high-performing districts in growing communities. Others serve deep-poverty populations in declining areas. The cap makes them identical in the data.
Farmington, for example, is a growing district in Washington County near Fayetteville. It almost certainly graduates well above 95 percent of its students. But because its reported rate is capped, there is no way to confirm that from public data, and no way to track whether its rate is rising or falling over time.
What Could Be Different
Other states handle small-cohort suppression differently. Some suppress the number entirely, reporting it as "N/A" or "*" rather than substituting a fixed value. Others use ranges ("90-100%") that at least indicate the band of performance. Arkansas's approach of reporting a specific number (95.0) is arguably the least transparent option, because it looks like a real data point until you know to question it.
The 95 percent cap does not change Arkansas's statewide graduation rate of 89 percent. That number is calculated from the full cohort data before suppression is applied. But it does mean that roughly 30 percent of the district-level data (the data that parents, school boards, and researchers use to understand local performance) is functionally fictional.
Detailed code that reproduces the analysis and figures in this article is available exclusively to EdTribune subscribers.
Discussion
Sign in to join the discussion.
Loading comments...